Difference between revisions of "Geophysical Methods"
m (1 revision imported) |
|||
| (19 intermediate revisions by 2 users not shown) | |||
| Line 7: | Line 7: | ||
| − | ''' | + | '''Contributor(s):''' [[Dr. Lee Slater]] |
| Line 85: | Line 85: | ||
*[https://clu-in.org/characterization/technologies/geophysics/pages/decisionSupport.htm EPA Environmental Geophysics Decision Support System] | *[https://clu-in.org/characterization/technologies/geophysics/pages/decisionSupport.htm EPA Environmental Geophysics Decision Support System] | ||
*[https://clu-in.org/characterization/technologies/geophysics/ EPA Geophysic Notice] | *[https://clu-in.org/characterization/technologies/geophysics/ EPA Geophysic Notice] | ||
| − | *[https:// | + | *[https://www.youtube.com/watch?v=HTukq9jDOzM USGS Fractured Rock Geophysical Toolbox Video] |
Latest revision as of 16:58, 26 April 2022
Geophysical methods can be used for cost-effective site characterization and monitoring by observing variations in the electrical, magnetic, and seismic properties of subsurface materials. Common data collection approaches include borehole, surface, and cross borehole geophysics. Analysis of surface and cross borehole geophysical data produces images or spatially distributed models of subsurface properties. There are also common approaches for identifying the most appropriate geophysical methods and their limitations depending on project goals.
Related Article(s):
Contributor(s): Dr. Lee Slater
Key Resource(s):
Introduction
Here, we overview geophysical techniques commonly used by site remediation professionals. We include measuring near surface geophysical properties and how these properties relate to contamination and remediation, geophysical survey methods and data analysis, hydrogeophysical characterization of contaminated sites, and geophysical methods for monitoring remediation.
Many geophysical properties of near surface geologic materials are controlled by the intrinsic properties of the solid, liquid, and gaseous phases and their geometric arrangement. Contamination and remediation of these materials alter the chemical composition of the pore-filling fluids and can change their electrical, electromagnetic, and seismic properties. Low-frequency electrical properties are primarily determined by electrolytic conduction occurring through pores and ionic conduction in the electrical double-layer (EDL) that forms at the grain-fluid interface. The minerals themselves (excluding metallic minerals) are poor conductors and therefore considered insulators. High frequency electrical properties are also strongly controlled by the presence of water and the geometric arrangement of the solid, liquid, and gas phases in the earth materials. Similarly, the strong difference in seismic velocities between the pore-filling fluids and the mineral matrix control the seismic properties. Consequently, geophysical properties are often related to porosity, pore connectivity, permeability, water content, and the physicochemical properties of the fluids themselves. Measuring variations in geophysical properties can provide valuable information required to understand the fate of contaminants in the subsurface and the subsurface's architecture.
The magnetic properties of the near surface Earth are also relevant to contamination assessment. Magnetic properties of the near surface are affected by erosion and deposition, along with multiple biogeochemical processes controlling iron cycling. Contaminant transformations associated with active or natural attenuation can modify magnetic properties through the formation or dissolution of iron minerals[3][4].
Common methods of acquiring geophysical data include borehole logging, surface-based, and cross-borehole methods. Borehole logging often provides the highest resolution information on materials immediately adjoining the borehole. Surface-based approaches can provide information for much larger aquifer volumes, but this information tends to be lower resolution than from borehole logging. Cross-borehole methods provide intermediate resolution and coverage compared to borehole and surface-based methods.
Borehole Logging
Borehole logging tools have been available for decades and are routinely used at remediation sites. Collection and interpretation of borehole geophysical data is usually straightforward. A logging tool is lowered into a borehole and sensors record vertical variations in geophysical properties for a localized, rock mass volume just beyond the borehole wall. Most geophysical logs provide a direct measure of a geophysical property without the need for complex data interpretation. We list common borehole-logging tools used at contaminated sites in Table 1.
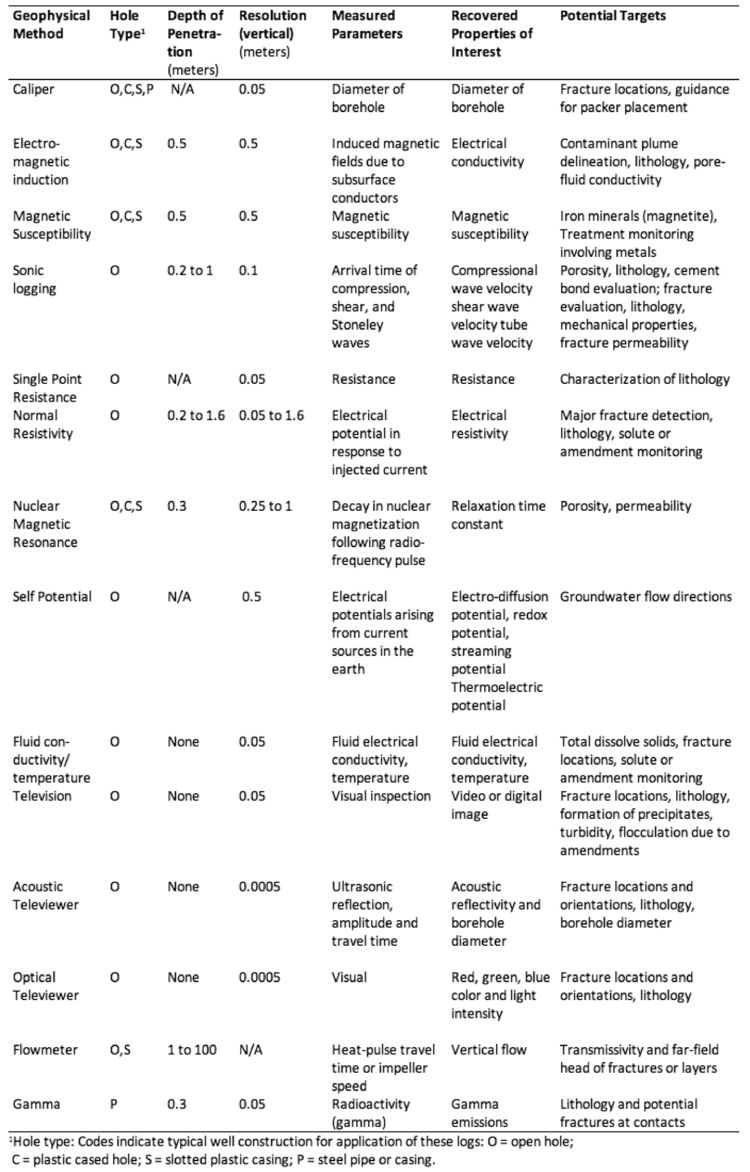
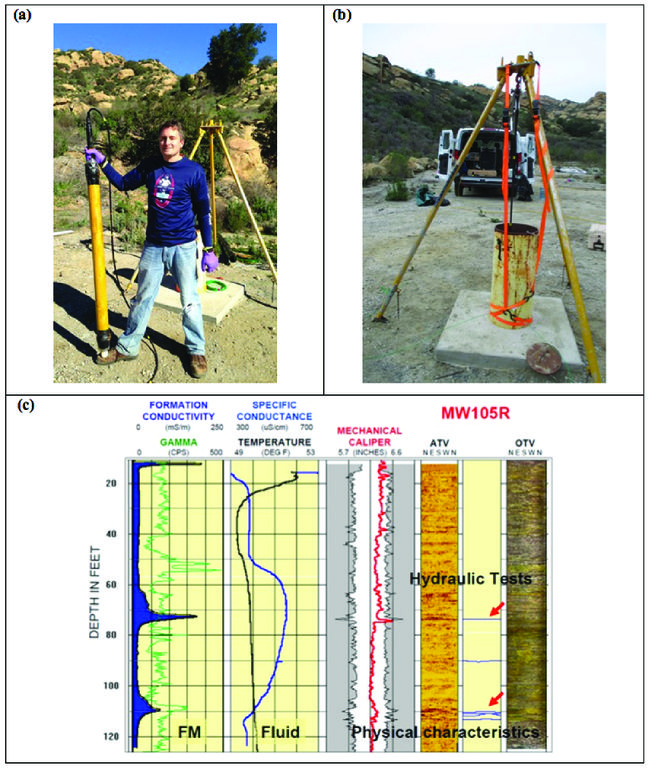
Processing most geophysical logs is limited to generating vertical profiles of geophysical properties, and then qualitative interpretation of the vertical variations of the physical properties in terms of hydrogeological units or variations in groundwater composition. Borehole logging equipment is physically manageable and the associated geophysical logs often show variations in parameters as a function of depth (Fig. 1). For example, Figure 1c shows vertical variations in the formation electrical conductivity, the specific conductance of the fluids filling the interconnected pore spaces, the vugosity of the borehole determined from a caliper log, and acoustic televiewer imaging of the borehole wall[5]. By jointly interpreting such data, one can infer fracture locations, geologic contacts, and transmissive intervals within/adjacent to the borehole. The interpretation of such well-established logs is relatively straightforward. However, the interpretation of temperature[6], flow meter[7], and cross-hole flow meter[8] logging can be substantially more complicated.
Surface-Based Methods
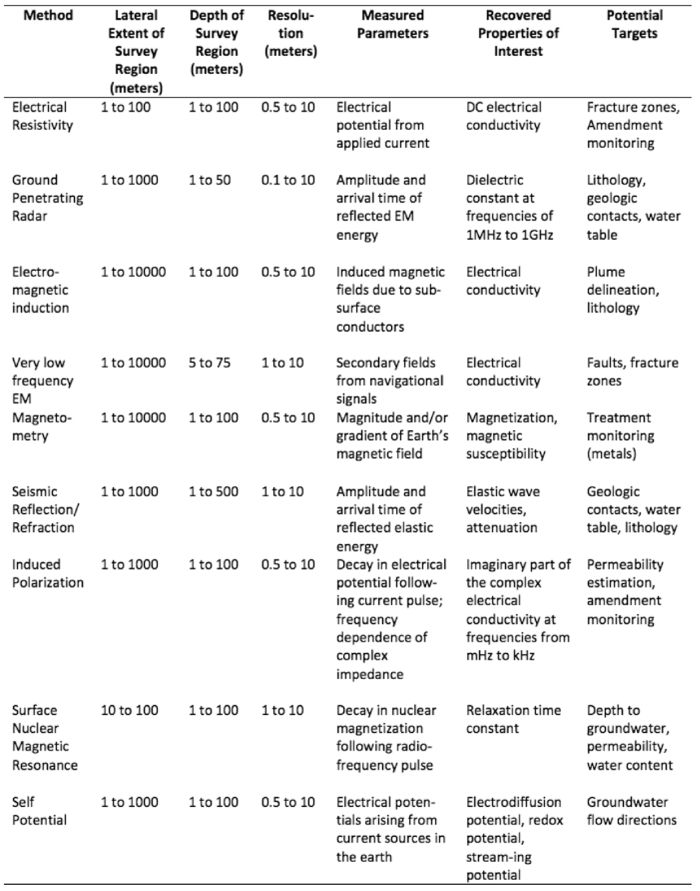
Surface-based geophysical imaging is fundamentally different from borehole logging because spatial variations in subsurface physical properties are reconstructed from measurements acquired using sensors placed on the surface of the Earth (Fig. 2). In borehole logging, the source and sensor are physically moved deeper into the Earth to directly sense vertical variations in physical properties. In surface imaging, sensors (e.g. electrodes in resistivity surveys, geophones in seismic surveys) are distributed across the surface either in a line (a 2D survey) or on a grid (a 3D survey). Table 2 summarizes the surface-based geophysical methods commonly used at contaminated sites.
Parameter estimation or ‘inverse’ methods (described below) are needed to reconstruct lateral and vertical variations in geophysical properties from the sensor observations. The spatial resolution and depth of investigation is controlled by (1) the position and number of sensors, (2) the number and configuration of measurements acquired, (3) the size of the sources and resulting energy produced/data quality, and (4) the unknown distribution of the geophysical properties. The resolution of all surface-based geophysical imaging decreases with distance from the sensors (i.e. depth).
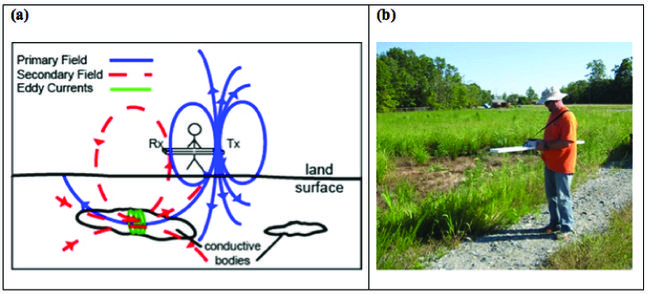
A site remediation professional should tread cautiously when engaging a geophysical contractor for surface geophysical imaging services. Collection and analysis of surface geophysical data is a complicated task involving numerous decisions about survey design. We tabulate recommendations for assessing the appropriateness of different geophysical approaches for different potential targets (Table 2).
Cross-Borehole Methods
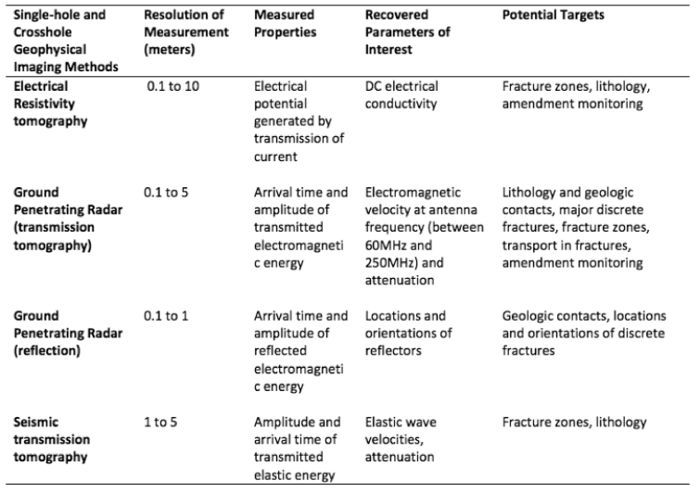
Cross-borehole imaging methods are potentially very powerful, but remain a specialty application in site remediation. Cross-borehole imaging is an extension of surface imaging where sensors are placed in a limited number of boreholes in order to perform high resolution (relative to surface imaging) imaging of the Earth between the boreholes (Fig. 3). By placing sensors in boreholes, resolution does not decrease with depth from the Earth surface compared to surface-based approaches. Instead, resolution decreases towards the inter-borehole region away from the sensors. Consequently, cross-borehole imaging becomes ineffective (due to resolution limitations) when the boreholes containing the sensors are too far apart. A general rule of thumb in cross-borehole imaging is that the ratio of the vertical borehole distance containing sensors to the borehole separation should be no less than 1.5. Once again, the information content (spatial resolution, depth of investigation) in the measurements at the sensors is controlled by (1) the position and number of sensors, (2) the number and configuration of measurements acquired, (3) the size of the sources and resulting energy produced/data quality, and (4) the unknown distribution of the geophysical properties themselves. There are several common cross-borehole methods that are used at contaminated sites (Table 3).
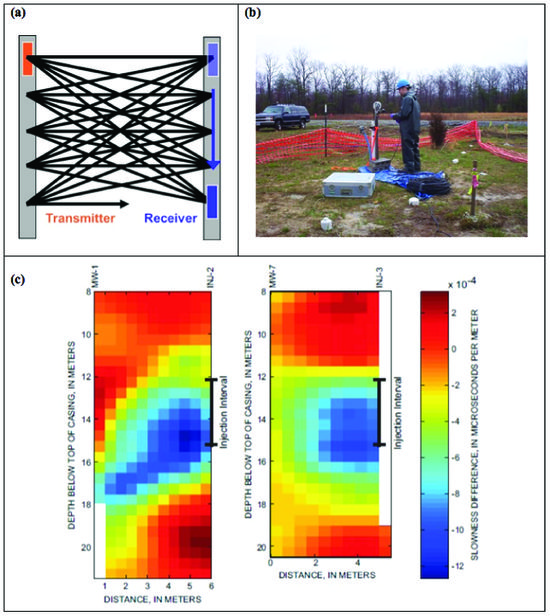
Relative to surface imaging, cross-borehole imaging requires additional expertize to perform worthwhile surveys. Parameter estimation or ‘inverse’ methods (described below) are used to reconstruct the variations in physical properties between boreholes that best satisfy the measurements are more specialized and less available. All imaging methods rely on the position of the sensors being precisely known. This is a straightforward requirement for surface imaging surveys where the sensors are visible. In contrast, cross-borehole imaging requires accurate borehole deviation logs to determine the assumed sensor positions. Errors in the location of the sensors will generate errors in the resulting images. The presence of the borehole itself complicates the estimation of the physical properties, as the fluid-filled borehole has physical properties that are different from the rock matrix. This can complicate image reconstruction and result in significant artifacts if the boreholes are not explicitly incorporated in the modeling. In summary, only highly skilled geophysical service contractors with experience performing cross-borehole geophysical imaging should be contracted by a site remediation professional.
Analysis and Modeling of Surface and Cross Borehole Data
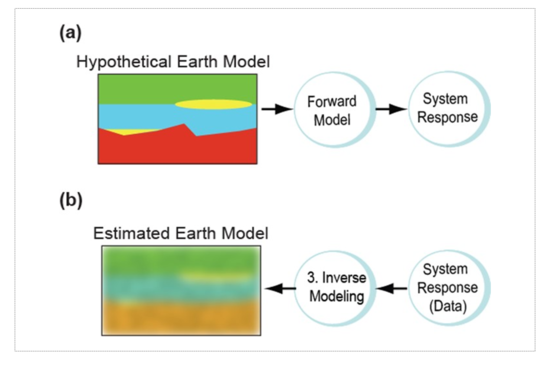
Surface and cross borehole geophysical imaging methods rely on geophysical data analysis to generate the images that provide estimates of subsurface structure away from the sensors. Two main computational methods are used in this processing are forward and inversion modeling (Fig. 4).
Forward Modeling
Forward (or synthetic) modeling (Fig. 4a) can be used to evaluate whether specific geophysical measurements are worthwhile at a given site. In this approach, the approximate size and physical property contrast between the target and background are estimated and used to generate synthetic datasets that represent the data that might be acquired in the field. These synthetic datasets can be corrupted with noise to better represent true field data, and then inverted to examine whether the target is likely to be detected with the proposed geophysical method. While forward modeling can never prove a geophysical method will be effective at a site, it can identify situations where that method will not be effective. Forward modeling should always be done prior to expending the time and expense of surface or cross borehole survey.
Parameter Estimation or ‘Inverse’ Modeling
Parameter estimation or ‘inverse’ modeling (Fig. 4b) are used to estimate the spatial distribution of geophysical properties based on measurements at individual points. The most common inverse methods use an iterative approach where a mathematical model attempts to minimize the difference between the field measurements and the theoretical predictions based on a forward model for a synthetic model. Iterative parameter updates continue until these differences are less than the convergence criteria. At this point, the estimated model is a plausible representation of the physical structure of the subsurface. Unfortunately, geophysical inverse problems are usually under-determined, meaning there are many more model parameters than sensor observations. In this case, several different images or representations of the subsurface can match the field observations equally well. Additional model constraints are often included to favor certain models or images over others to narrow down the plausible possibilities further.
One of the most common constraints is called smooth inversion or smoothness constrained inversion because it produces models with smooth variations in physical properties. The result of a smoothness-constrained inversion is somewhat akin to looking at the earth with a very bad pair of glasses. The true structure appears ‘fuzzy’ and provides a low resolution glimpse into the structure of the earth (Fig. 4b)[10], which is a low-resolution approximation of the true subsurface structure (e.g., Fig. 4a). Site remediation professionals should be wary of high-resolution images with lots of structural detail. This structural detail may arise from an error in the inverse modeling. Reliable inverse modeling requires a trained user knowing how to correctly set up an inverse model and appropriately handle the data errors.
Interpreting Modeling Results Caveats
While some subsurface processes do result in a smooth transition (i.e. the diffuse edge of a contaminant plume), the interface between an aquifer and an aquitard may not be well represented by a smoothness constraint. Alternative model constraints can be included to honor such sharp contrasts. However, commercially available inverse codes often implement smooth regularization by default. Site remediation professionals should interpret smooth images with caution and question whether the smoothness constraint is likely to provide a meaningful image based on the site conceptual model. For example, fractured sedimentary rock aquifers are often characterized by very sharp physical property contrasts between fractured zones and native rock mass. The use of smoothness constraints for inversion of geophysical data from fractured rock aquifers may not be appropriate.
There are numerous caveats to the interpretation of subsurface structures based on geophysical images generated by inverse methods. Use of a 2D survey to characterize a 3D object can introduce errors and artifacts into the images generated by the inverse model. 3D surveys are now increasingly being implemented in environmental investigations, but demand a high level of expertise to execute and evaluate the results effectively.
How to Select the Right Geophysical Method?
To site remediation professionals, geophysics may feel like voodoo. Drilling provides direct information on the subsurface, and ground water sampling allows direct measurement of fluid chemistry. The information acquired is relatively straightforward to interpret and very tangible. In contrast, geophysics offers the opportunity to look into the Earth and capture distributions in physical properties. However, the geophysical properties that are measured are not always directly related to the hydrologic and chemical parameters that are of actual interest for site management. In addition, the science behind geophysics is complex and site managers must rely on geophysical contractors to perform the measurements and data processing. Unfortunately, geophysics has been applied at some sites without a full understanding of the limitations of this approach.
Technology transfer tools are being developed to help site managers make informed decisions about geophysics. The Fractured Rock Geophysics Toolbox-Methods Selection Tool (FRGT-MST)[11] is a user-friendly Excel-based tool available from the U.S. Geological Survey (FRGT-MST) to help identify appropriate and effective geophysical methods for specific project goals and site conditions. This toolbox comprises 30 different geophysical methods divided into 4 categories: surface, cross-hole, borehole, and hydrologic. The user enters information in two tables (1) project and site parameters, including budget level; and (2) project goals. A third table is populated with indicators for whether each method could potentially support any of the specified goals, and whether each method is likely to work at the site described. The suite of potentially suitable methods is the intersection of the sets of appropriate and feasible methods.
References
- ^ Rubin, Y. and Hubbard, S.S. eds., 2006. Hydrogeophysics (Vol. 50). Springer Science & Business Media. 523 pgs. doi: 10.1007/1-4020-3102-5
- ^ Vereecken, H., Binley, A., Cassiani, G., Revil, A. and K. Titov, eds, 2006. Applied Hydrogeophysics. Springer Netherlands. 371 pgs. doi: 10.1007/978-1-4020-4912-5
- ^ Atekwana, E.A. and Slater, L.D., 2009. Biogeophysics: A new frontier in earth science research. Reviews of Geophysics, 47(4), RG4004. doi: 10.1029/2009RG000285
- ^ Atekwana, E.A., Mewafy, F.M., Abdel Aal, G., Werkema, D.D., Revil, A. and Slater, L.D., 2014. High‐resolution magnetic susceptibility measurements for investigating magnetic mineral formation during microbial mediated iron reduction. Journal of Geophysical Research: Biogeosciences, 119(1), 80-94. doi: 10.1002/2013JG002414
- ^ 5.0 5.1 Johnson, C.D., Haeni, F.P., Lane, J.W. and White, E.A., 2002. Borehole-geophysical investigation of the University of Connecticut landfill, Storrs, Connecticut: US Geological Survey. Water Resources Investigations Report 01-4033. Report pdf
- ^ Koch, F.W., Voytek, E.B., Day‐Lewis, F.D., Healy, R., Briggs, M.A., Lane, J.W. and Werkema, D., 2015. 1DTempPro V2: New Features for Inferring Groundwater/Surface‐Water Exchange. Groundwater., 54, 434-439. doi: 10.1111/gwat.12369
- ^ Day-Lewis, F.D., Johnson, C.D., and Paillet, F.L., 2011. FLASH: A Computer Program for Flowmeter Log Analysis for Single Holes, Ground Water, 49, 926–931. doi:10.1111/j.1745-6584.2011.00798.x
- ^ Roubinet, D., Irving, J. and Day-Lewis, F.D., 2015. Development of a new semi-analytical model for cross-borehole flow experiments in fractured media. Advances in Water Resources, 76, 97-108. doi: 10.1016/j.advwatres.2014.12.002
- ^ Lane, J.W., Day‐Lewis, F.D. and Casey, C.C., 2006. Geophysical monitoring of a field‐scale biostimulation pilot project. Ground water, 44(3), 430-443. doi: 10.1111/j.1745-6584.2005.00134.x
- ^ Day‐Lewis, F.D., Singha, K. and Binley, A.M., 2005. Applying petrophysical models to radar travel time and electrical resistivity tomograms: Resolution‐dependent limitations. Journal of Geophysical Research: Solid Earth, 110, B08206. doi:10.1029/2004JB003569
- ^ Day-Lewis, F.D., Johnson, C.D., Slater, L.D., Robinson, J.L., Williams, J.H., Boyden, C.L., Werkema, D.D. and Lane, J.W., 2016. A fractured rock geophysical toolbox method selection tool. Groundwater, 54(3), 315-316. doi: 10.1111/gwat.12397
See Also
- USGS Branch of Geophysics
- Fractured Rock Geophysical Toolbox Method Selection Tool
- Rutgers Technology Transfer
- T2-Geophysics (ER-201567-T2)
- Fractured Rock Geophysics Toolbox for Characterization and Monitoring of DNAPL Biodegradation in Fractured Rock Aquifers
- EPA Environmental Geophysics Decision Support System
- EPA Geophysic Notice
- USGS Fractured Rock Geophysical Toolbox Video
