|
|
| (129 intermediate revisions by the same user not shown) |
| Line 1: |
Line 1: |
| − | ==Lysimeters for Measuring PFAS Concentrations in the Vadose Zone== | + | ==Estimating PCE/TCE Abiotic First-Order Reductive Dechlorination Rate Constants in Clayey Soils Under Anoxic Conditions== |
| − | [[Perfluoroalkyl and Polyfluoroalkyl Substances (PFAS) | PFAS]] are frequently introduced to the environment through soil surface applications which then transport through the vadose zone to reach underlying groundwater receptors. Due to their unique properties and resulting transport and retention behaviors, PFAS in the vadose zone can be a persistent contaminant source to underlying groundwater systems. Determining the fraction of PFAS present in the mobile porewater relative to the total concentrations in soils is critical to understanding the risk posed by PFAS in vadose zone source areas. Lysimeters are instruments that have been used by agronomists and vadose zone researchers for decades to determine water flux and solute concentrations in unsaturated porewater. Lysimeters have recently been developed as a critical tool for field investigations and characterizations of PFAS impacted source zones.
| + | The U.S. Department of Defense (DoD) faces many challenges in restoring aquifers at contaminated sites, often due to back-diffusion of tetrachloroethene (PCE) and trichloroethene (TCE) from low-permeability clay zones. The uptake, storage, and subsequent long-term release of these dissolved contaminants from clays are key processes in understanding the longevity, intensity, and risks associated with many persistent chlorinated ethene groundwater plumes. Although naturally occurring abiotic and biotic dechlorination processes in clays may reduce stored contaminant mass and significantly aid natural attenuation, no standardized field method currently exists to verify or quantify these reactions. It is critical to remediation design efforts to demonstrate and validate a cost-effective in situ approach for assessing these dechlorination processes using first-order rate constants. An approach was developed and applied across eight DoD sites to support Remedial Project Managers (RPMs) and regulators in evaluating natural attenuation potential in clay-rich environments. |
| | <div style="float:right;margin:0 0 2em 2em;">__TOC__</div> | | <div style="float:right;margin:0 0 2em 2em;">__TOC__</div> |
| | | | |
| | '''Related Article(s):''' | | '''Related Article(s):''' |
| | | | |
| − | *[[Perfluoroalkyl and Polyfluoroalkyl Substances (PFAS)]] | + | *[[Monitored Natural Attenuation (MNA)]] |
| − | *[[PFAS Transport and Fate]] | + | *[[Monitored Natural Attenuation (MNA) of Chlorinated Solvents]] |
| | + | *[[Monitored Natural Attenuation - Transitioning from Active Remedies]] |
| | + | *[[Matrix Diffusion]] |
| | + | *[[REMChlor - MD]] |
| | | | |
| − | '''Contributors:''' Gorm Heron, Emily Crownover, Patrick Joyce, Ramona Iery | + | '''Contributors:''' Dani Tran, Dr. Charles Schaefer, Dr. Charles Werth |
| | | | |
| | '''Key Resource:''' | | '''Key Resource:''' |
| − | *Perfluoroalkyl and polyfluoroalkyl substances thermal desorption evaluation | + | *Schaefer, C.E, Tran, D., Nguyen, D., Latta, D.E., Werth, C.J., 2025. Evaluating Mineral and In Situ Indicators of Abiotic Dechlorination in Clayey Soils<ref name="SchaeferEtAl2025"/> |
| | | | |
| | ==Introduction== | | ==Introduction== |
| − | Lysimeters are devices that are placed in the subsurface above the groundwater table to monitor the movement of water through the soil<ref name="GossEhlers2009">Goss, M.J., Ehlers, W., 2009. The Role of Lysimeters in the Development of Our Understanding of Soil Water and Nutrient Dynamics in Ecosystems. Soil Use and Management, 25(3), pp. 213–223. [https://doi.org/10.1111/j.1475-2743.2009.00230.x doi: 10.1111/j.1475-2743.2009.00230.x]</ref><ref>Pütz, T., Fank, J., Flury, M., 2018. Lysimeters in Vadose Zone Research. Vadose Zone Journal, 17 (1), pp. 1-4. [https://doi.org/10.2136/vzj2018.02.0035 doi: 10.2136/vzj2018.02.0035] [[Media: PutzEtAl2018.pdf | Open Access Article]]</ref><ref name="CostanzaEtAl2025">Costanza, J., Clabaugh, C.D., Leibli, C., Ferreira, J., Wilkin, R.T., 2025. Using Suction Lysimeters for Determining the Potential of Per- and Polyfluoroalkyl Substances to Leach from Soil to Groundwater: A Review. Environmental Science and Technology, 59(9), pp. 4215-4229. [https://doi.org/10.1021/acs.est.4c10246 doi: 10.1021/acs.est.4c10246]</ref>. Lysimeters have historically been used in agricultural sciences for monitoring nutrient or contaminant movement, soil moisture release curves, natural drainage patterns, and dynamics of plant-water interactions<ref name="GossEhlers2009"/><ref>Bergström, L., 1990. Use of Lysimeters to Estimate Leaching of Pesticides in Agricultural Soils. Environmental Pollution, 67 (4), 325–347. [https://doi.org/10.1016/0269-7491(90)90070-S doi: 10.1016/0269-7491(90)90070-S]</ref><ref>Dabrowska, D., Rykala, W., 2021. A Review of Lysimeter Experiments Carried Out on Municipal Landfill Waste. Toxics, 9(2), Article 26. [https://doi.org/10.3390/toxics9020026 doi: 10.3390/toxics9020026] [[Media: Dabrowska Rykala2021.pdf | Open Access Article]]</ref><ref>Fernando, S.U., Galagedara, L., Krishnapillai, M., Cuss, C.W., 2023. Lysimeter Sampling System for Optimal Determination of Trace Elements in Soil Solutions. Water, 15(18), Article 3277. [https://doi.org/10.3390/w15183277 doi: 10.3390/w15183277] [[Media: FernandoEtAl2023.pdf | Open Access Article]]</ref><ref name="MeissnerEtAl2020">Meissner, R., Rupp, H., Haselow, L., 2020. Use of Lysimeters for Monitoring Soil Water Balance Parameters and Nutrient Leaching. In: Climate Change and Soil Interactions. Elsevier, pp. 171-205. [https://doi.org/10.1016/B978-0-12-818032-7.00007-2 doi: 10.1016/B978-0-12-818032-7.00007-2]</ref><ref name="RogersMcConnell1993">Rogers, R.D., McConnell, J.W. Jr., 1993. Lysimeter Literature Review, Nuclear Regulatory Commission Report Numbers: NUREG/CR--6073, EGG--2706. [https://www.osti.gov/] ID: 10183270. [https://doi.org/10.2172/10183270 doi: 10.2172/10183270] [[Media: RogersMcConnell1993.pdf | Open Access Article]]</ref><ref>Sołtysiak, M., Rakoczy, M., 2019. An Overview of the Experimental Research Use of Lysimeters. Environmental and Socio-Economic Studies, 7(2), pp. 49-56. [https://doi.org/10.2478/environ-2019-0012 doi: 10.2478/environ-2019-0012] [[Media: SołtysiakRakoczy2019.pdf | Open Access Article]]</ref><ref name="Stannard1992">Stannard, D.I., 1992. Tensiometers—Theory, Construction, and Use. Geotechnical Testing Journal, 15(1), pp. 48-58. [https://doi.org/10.1520/GTJ10224J doi: 10.1520/GTJ10224J]</ref><ref name="WintonWeber1996">Winton, K., Weber, J.B., 1996. A Review of Field Lysimeter Studies to Describe the Environmental Fate of Pesticides. Weed Technology, 10(1), pp. 202-209. [https://doi.org/10.1017/S0890037X00045929 doi: 10.1017/S0890037X00045929]</ref>. Recently, there has been strong interest in the use of lysimeters to measure and monitor movement of per- and polyfluoroalkyl substances (PFAS) through the vadose zone<ref name="Anderson2021">Anderson, R.H., 2021. The Case for Direct Measures of Soil-to-Groundwater Contaminant Mass Discharge at AFFF-Impacted Sites. Environmental Science and Technology, 55(10), pp. 6580-6583. [https://doi.org/10.1021/acs.est.1c01543 doi: 10.1021/acs.est.1c01543]</ref><ref name="AndersonEtAl2022">Anderson, R.H., Feild, J.B., Dieffenbach-Carle, H., Elsharnouby, O., Krebs, R.K., 2022. Assessment of PFAS in Collocated Soil and Porewater Samples at an AFFF-Impacted Source Zone: Field-Scale Validation of Suction Lysimeters. Chemosphere, 308(1), Article 136247. [https://doi.org/10.1016/j.chemosphere.2022.136247 doi: 10.1016/j.chemosphere.2022.136247]</ref><ref name="SchaeferEtAl2024">Schaefer, C.E., Nguyen, D., Fang, Y., Gonda, N., Zhang, C., Shea, S., Higgins, C.P., 2024. PFAS Porewater Concentrations in Unsaturated Soil: Field and Laboratory Comparisons Inform on PFAS Accumulation at Air-Water Interfaces. Journal of Contaminant Hydrology, 264, Article 104359. [https://doi.org/10.1016/j.jconhyd.2024.104359 doi: 10.1016/j.jconhyd.2024.104359] [[Media: SchaeferEtAl2024.pdf | Open Access Manuscript]]</ref><ref name="SchaeferEtAl2023">Schaefer, C.E., Lavorgna, G.M., Lippincott, D.R., Nguyen, D., Schaum, A., Higgins, C.P., Field, J., 2023. Leaching of Perfluoroalkyl Acids During Unsaturated Zone Flushing at a Field Site Impacted with Aqueous Film Forming Foam. Environmental Science and Technology, 57(5), pp. 1940-1948. [https://doi.org/10.1021/acs.est.2c06903 doi: 10.1021/acs.est.2c06903]</ref><ref name="SchaeferEtAl2022">Schaefer, C.E., Lavorgna, G.M., Lippincott, D.R., Nguyen, D., Christie, E., Shea, S., O’Hare, S., Lemes, M.C.S., Higgins, C.P., Field, J., 2022. A Field Study to Assess the Role of Air-Water Interfacial Sorption on PFAS Leaching in an AFFF Source Area. Journal of Contaminant Hydrology, 248, Article 104001. [https://doi.org/10.1016/j.jconhyd.2022.104001 doi: 10.1016/j.jconhyd.2022.104001] [[Media: SchaeferEtAl2022.pdf | Open Access Manuscript]]</ref><ref name="QuinnanEtAl2021">Quinnan, J., Rossi, M., Curry, P., Lupo, M., Miller, M., Korb, H., Orth, C., Hasbrouck, K., 2021. Application of PFAS-Mobile Lab to Support Adaptive Characterization and Flux-Based Conceptual Site Models at AFFF Releases. Remediation, 31(3), pp. 7-26. [https://doi.org/10.1002/rem.21680 doi: 10.1002/rem.21680]</ref>. PFAS are frequently introduced to the environment through land surface application and have been found to be strongly retained within the upper 5 feet of soil<ref name="BrusseauEtAl2020">Brusseau, M.L., Anderson, R.H., Guo, B., 2020. PFAS Concentrations in Soils: Background Levels versus Contaminated Sites. Science of The Total Environment, 740, Article 140017. [https://doi.org/10.1016/j.scitotenv.2020.140017 doi: 10.1016/j.scitotenv.2020.140017]</ref><ref name="BiglerEtAl2024">Bigler, M.C., Brusseau, M.L., Guo, B., Jones, S.L., Pritchard, J.C., Higgins, C.P., Hatton, J., 2024. High-Resolution Depth-Discrete Analysis of PFAS Distribution and Leaching for a Vadose-Zone Source at an AFFF-Impacted Site. Environmental Science and Technology, 58(22), pp. 9863-9874. [https://doi.org/10.1021/acs.est.4c01615 doi: 10.1021/acs.est.4c01615]</ref>. PFAS recalcitrance in the vadose zone means that environmental program managers and consultants need a cost-effective way of monitoring concentration conditions within the vadose zone. Repeated soil sampling and extraction processes are time consuming and only give a representative concentration of total PFAS in the matrix<ref name="NickersonEtAl2020">Nickerson, A., Maizel, A.C., Kulkarni, P.R., Adamson, D.T., Kornuc, J. J., Higgins, C.P., 2020. Enhanced Extraction of AFFF-Associated PFASs from Source Zone Soils. Environmental Science and Technology, 54(8), pp. 4952-4962. [https://doi.org/10.1021/acs.est.0c00792 doi: 10.1021/acs.est.0c00792]</ref>, not what is readily transportable in mobile porewater<ref name="SchaeferEtAl2023"/><ref name="StultsEtAl2024">Stults, J.F., Schaefer, C.E., Fang, Y., Devon, J., Nguyen, D., Real, I., Hao, S., Guelfo, J.L., 2024. Air-Water Interfacial Collapse and Rate-Limited Solid Desorption Control Perfluoroalkyl Acid Leaching from the Vadose Zone. Journal of Contaminant Hydrology, 265, Article 104382. [https://doi.org/10.1016/j.jconhyd.2024.104382 doi: 10.1016/j.jconhyd.2024.104382] [[Media: StultsEtAl2024.pdf | Open Access Manuscript]]</ref><ref name="StultsEtAl2023">Stults, J.F., Choi, Y.J., Rockwell, C., Schaefer, C.E., Nguyen, D.D., Knappe, D.R.U., Illangasekare, T.H., Higgins, C.P., 2023. Predicting Concentration- and Ionic-Strength-Dependent Air–Water Interfacial Partitioning Parameters of PFASs Using Quantitative Structure–Property Relationships (QSPRs). Environmental Science and Technology, 57(13), pp. 5203-5215. [https://doi.org/10.1021/acs.est.2c07316 doi: 10.1021/acs.est.2c07316]</ref><ref name="BrusseauGuo2022">Brusseau, M.L., Guo, B., 2022. PFAS Concentrations in Soil versus Soil Porewater: Mass Distributions and the Impact of Adsorption at Air-Water Interfaces. Chemosphere, 302, Article 134938. [https://doi.org/10.1016/j.chemosphere.2022.134938 doi: 10.1016/j.chemosphere.2022.134938] [[Media: BrusseauGuo2022.pdf | Open Access Manuscript]]</ref>. Fortunately, lysimeters have been found to be a viable option for monitoring the concentration of PFAS in the mobile porewater phase in the vadose zone<ref name="Anderson2021"/><ref name="AndersonEtAl2022"/>. Note that while some lysimeters, known as weighing lysimeters, can directly measure water flux, the most commonly utilized lysimeters in PFAS investigations only provide measurements of porewater concentrations.
| + | Cost-effective methods are needed to verify the occurrence of natural dechlorination processes and quantify their dechlorination rates in clays under ambient in situ conditions in order to reliably predict their long-term influence on plume longevity and mass discharge. However, accurately determining these rates is challenging due to slow reaction kinetics, the transient nature of transformation products, and the interplay of biotic and abiotic mechanisms within the clay matrix or at clay-sand interfaces. Tools capable of quantifying these reactions and assessing their role in mitigating plume persistence would be a significant aid for long-term site management. |
| | | | |
| − | ==PFAS Background==
| + | For reductive abiotic dechlorination under anoxic conditions, a 1% hydrochloric acid (HCl) extraction of a sample of native clay coupled with X-ray diffraction (XRD) data can be used as a screening level tool to estimate reductive dechlorination rate constants. These rate constants can be inserted into fate and transport models such as [[REMChlor - MD]]<ref>Falta, R., and Wang, W., 2017. A semi-analytical method for simulating matrix diffusion in numerical transport models. Journal of Contaminant Hydrology, 197, pp. 39-49. [https://doi.org/10.1016/j.jconhyd.2016.12.007 doi: 10.1016/j.jconhyd.2016.12.007] [[Media: FaltaWang2017.pdf | Open Access Manuscript]]</ref><ref>Kulkarni, P.R., Adamson, D.T., Popovic, J., Newell, C.J., 2022. Modeling a well-charactized perfluorooctane sulfate (PFOS) source and plume using the REMChlor-MD model to account for matrix diffusion. Journal of Contaminant Hydrology, 247, Article 103986. [https://doi.org/10.1016/j.jconhyd.2022.103986 doi: 10.1016/j.jconhyd.2022.103986] [[Media: KulkarniEtAl2022.pdf | Open Access Manuscript]]</ref> to quantify abiotic dechlorination impacts within clay aquitards on chlorinated solvent plumes. Thus, determination of the abiotic reductive dechlorination rate constant for a particular clayey soil can be readily utilized to provide a more accurate assessment of aquifer cleanup timeframes for groundwater plumes that are being sustained by contaminant back-diffusion. |
| − | PFAS are a broad class of chemicals with highly variable chemical structures<ref>Moody, C.A., Field, J.A., 1999. Determination of Perfluorocarboxylates in Groundwater Impacted by Fire-Fighting Activity. Environmental Science and Technology, 33(16), pp. 2800-2806. [https://doi.org/10.1021/es981355+ doi: 10.1021/es981355+]</ref><ref name="MoodyField2000">Moody, C.A., Field, J.A., 2000. Perfluorinated Surfactants and the Environmental Implications of Their Use in Fire-Fighting Foams. Environmental Science and Technology, 34(18), pp. 3864-3870. [https://doi.org/10.1021/es991359u doi: 10.1021/es991359u]</ref><ref name="GlügeEtAl2020">Glüge, J., Scheringer, M., Cousins, I.T., DeWitt, J.C., Goldenman, G., Herzke, D., Lohmann, R., Ng, C.A., Trier, X., Wang, Z., 2020. An Overview of the Uses of Per- and Polyfluoroalkyl Substances (PFAS). Environmental Science: Processes and Impacts, 22(12), pp. 2345-2373. [https://doi.org/10.1039/D0EM00291G doi: 10.1039/D0EM00291G] [[Media: GlügeEtAl2020.pdf | Open Access Article]]</ref>. One characteristic feature of PFAS is that they are fluorosurfactants, distinct from more traditional hydrocarbon surfactants<ref name="MoodyField2000"/><ref name="Brusseau2018">Brusseau, M.L., 2018. Assessing the Potential Contributions of Additional Retention Processes to PFAS Retardation in the Subsurface. Science of The Total Environment, 613-614, pp. 176-185. [https://doi.org/10.1016/j.scitotenv.2017.09.065 doi: 10.1016/j.scitotenv.2017.09.065] [[Media: Brusseau2018.pdf | Open Access Manuscript]]</ref><ref>Dave, N., Joshi, T., 2017. A Concise Review on Surfactants and Its Significance. International Journal of Applied Chemistry, 13(3), pp. 663-672. [https://doi.org/10.37622/IJAC/13.3.2017.663-672 doi: 10.37622/IJAC/13.3.2017.663-672] [[Media: DaveJoshi2017.pdf | Open Access Article]]</ref><ref>García, R.A., Chiaia-Hernández, A.C., Lara-Martin, P.A., Loos, M., Hollender, J., Oetjen, K., Higgins, C.P., Field, J.A., 2019. Suspect Screening of Hydrocarbon Surfactants in Afffs and Afff-Contaminated Groundwater by High-Resolution Mass Spectrometry. Environmental Science and Technology, 53(14), pp. 8068-8077. [https://doi.org/10.1021/acs.est.9b01895 doi: 10.1021/acs.est.9b01895]</ref>. Fluorosurfactants typically have a fully or partially fluorinated, hydrophobic tail with ionic (cationic, zwitterionic, or anionic) head group that is hydrophilic<ref name="MoodyField2000"/><ref name="GlügeEtAl2020"/>. The hydrophobic tail and ionic head group mean PFAS are very stable at hydrophobic adsorption interfaces when present in the aqueous phase<ref>Krafft, M.P., Riess, J.G., 2015. Per- and Polyfluorinated Substances (PFASs): Environmental Challenges. Current Opinion in Colloid and Interface Science, 20(3), pp. 192-212. [https://doi.org/10.1016/j.cocis.2015.07.004 doi: 10.1016/j.cocis.2015.07.004]</ref>. Examples of these interfaces include naturally occurring organic matter in soils and the air-water interface in the vadose zone<ref>Schaefer, C.E., Culina, V., Nguyen, D., Field, J., 2019. Uptake of Poly- and Perfluoroalkyl Substances at the Air–Water Interface. Environmental Science and Technology, 53(21), pp. 12442-12448. [https://doi.org/10.1021/acs.est.9b04008 doi: 10.1021/acs.est.9b04008]</ref><ref>Lyu, Y., Brusseau, M.L., Chen, W., Yan, N., Fu, X., Lin, X., 2018. Adsorption of PFOA at the Air–Water Interface during Transport in Unsaturated Porous Media. Environmental Science and Technology, 52(14), pp. 7745-7753. [https://doi.org/10.1021/acs.est.8b02348 doi: 10.1021/acs.est.8b02348]</ref><ref>Costanza, J., Arshadi, M., Abriola, L.M., Pennell, K.D., 2019. Accumulation of PFOA and PFOS at the Air-Water Interface. Environmental Science and Technology Letters, 6(8), pp. 487-491. [https://doi.org/10.1021/acs.estlett.9b00355 doi: 10.1021/acs.estlett.9b00355]</ref><ref>Li, F., Fang, X., Zhou, Z., Liao, X., Zou, J., Yuan, B., Sun, W., 2019. Adsorption of Perfluorinated Acids onto Soils: Kinetics, Isotherms, and Influences of Soil Properties. Science of The Total Environment, 649, pp. 504-514. [https://doi.org/10.1016/j.scitotenv.2018.08.209 doi: 10.1016/j.scitotenv.2018.08.209]</ref><ref>Nguyen, T.M.H., Bräunig, J., Thompson, K., Thompson, J., Kabiri, S., Navarro, D.A., Kookana, R.S., Grimison, C., Barnes, C.M., Higgins, C.P., McLaughlin, M.J., Mueller, J.F., 2020. Influences of Chemical Properties, Soil Properties, and Solution pH on Soil–Water Partitioning Coefficients of Per- and Polyfluoroalkyl Substances (PFASs). Environmental Science and Technology, 54(24), pp. 15883-15892. [https://doi.org/10.1021/acs.est.0c05705 doi: 10.1021/acs.est.0c05705] [[Media: NguyenEtAl2020.pdf | Open Access Article]]</ref>. Their strong adsorption to both soil organic matter and the air-water interface is a major contributor to elevated concentrations of PFAS observed in the upper 5 feet of the soil column<ref name="BrusseauEtAl2020"/><ref name="BiglerEtAl2024"/>. While several other PFAS partitioning processes exist<ref name="Brusseau2018"/>, adsorption to solid phase soils and air-water interfaces are the two primary processes present at nearly all PFAS sites<ref>Brusseau, M.L., Yan, N., Van Glubt, S., Wang, Y., Chen, W., Lyu, Y., Dungan, B., Carroll, K.C., Holguin, F.O., 2019. Comprehensive Retention Model for PFAS Transport in Subsurface Systems. Water Research, 148, pp. 41-50. [https://doi.org/10.1016/j.watres.2018.10.035 doi: 10.1016/j.watres.2018.10.035]</ref>. The total PFAS mass obtained from a vadose zone soil sample contains the solid phase, air-water interfacial, and aqueous phase PFAS mass, which can be converted to porewater concentrations using Equation 1<ref name="BrusseauGuo2022"/>.</br>
| |
| − | :: <big>'''Equation 1:'''</big> [[File: StultsEq1.png | 400 px]]</br>
| |
| − | Where ''C<sub>p</sub>'' is the porewater concentration, ''C<sub>t</sub>'' is the total PFAS concentration, ''ρ<sub>b</sub>'' is the bulk density of the soil, ''θ<sub>w</sub>'' is the volumetric water content, ''R<sub>d</sub>'' is the PFAS retardation factor, ''K<sub>d</sub>'' is the solid phase adsorption coefficient, ''K<sub>ia</sub>'' is the air-water interfacial adsorption coefficient, and ''A<sub>aw</sub>'' is the air-water interfacial area. The air-water interfacial area of the soil is primarily a function of both the soil properties and the degree of volumetric water saturation in the soil. There are several methods of estimating air-water interfacial areas including thermodynamic functions based on the soil moisture retention curve. However, the thermodynamic function has been shown to underestimate air-water interfacial area<ref name="Brusseau2023">Brusseau, M.L., 2023. Determining Air-Water Interfacial Areas for the Retention and Transport of PFAS and Other Interfacially Active Solutes in Unsaturated Porous Media. Science of The Total Environment, 884, Article 163730. [https://doi.org/10.1016/j.scitotenv.2023.163730 doi: 10.1016/j.scitotenv.2023.163730] [[Media: Brusseau2023.pdf | Open Access Article]]</ref>, and must typically be scaled using empirical scaling factors. An empirical method recently developed to estimate air-water interfacial area is presented in Equation 2<ref name="Brusseau2023"/>.</br>
| |
| − | :: <big>'''Equation 2:'''</big> [[File: StultsEq2.png | 400 px]]</br>
| |
| − | Where ''S<sub>w</sub>'' is the water phase saturation as a ratio of the water content over the volumetric soil porosity, and ''d<sub>50</sub>'' is the median grain diameter.
| |
| | | | |
| − | ==Lysimeters Background== | + | ==Recommended Approach== |
| − | [[File: StultsFig1.png |thumb|600 px|Figure 1. (a) A field suction lysimeter with labeled parts typically used in field settings – Credit: Bibek Acharya and Dr. Vivek Sharma, UF/IFAS, https://edis.ifas.ufl.edu/publication/AE581. (b) Laboratory suction lysimeters used in Schaefer ''et al.'' 2024<ref name="SchaeferEtAl2024"/>, which employed the use of micro-sampling suction lysimeters. (c) A field lysimeter used in Schaefer ''et al.'' 2023<ref name="SchaeferEtAl2023"/>. (d) Diagram of a drainage wicking lysimeter – Credit: Edaphic Scientific, https://edaphic.com.au/products/water/lysimeter-wick-for-drainage/]] | + | [[File: TranFig1.png | thumb | 500 px | Figure 1: First-order rate constants for abiotic reductive dechlorination of TCE under anaerobic conditions. Circles are data from Schaefer ''et al.'', 2021<ref>Schaefer, C.E., Ho, P., Berns, E., Werth, C., 2021. Abiotic dechlorination in the presence of ferrous minerals. Journal of Contaminant Hydrology, 241, 103839. [https://doi.org/10.1016/j.jconhyd.2021.103839 doi: 10.1016/j.jconhyd.2021.103839] [[Media: SchaeferEtAl2021.pdf | Open Access Manuscript]]</ref>, filled squares from Schaefer ''et al.'', 2018<ref name="SchaeferEtAl2018"/>, and Schaefer ''et al.'', 2017<ref>Schaefer, C.E., Ho., Gurr, C., Berns, E., Werth, C., 2017. Abiotic dechlorination of chlorinated ethenes in natural clayey soils: impacts of mineralogy and temperature. Journal of Contaminant Hydrology, 206, pp. 10-17. [https://doi.org/10.1016/j.jconhyd.2017.09.007 doi: 10.1016/j.jconhyd.2017.09.007] [[Media: SchaeferEtAl2017.pdf | Open Access Manuscript]]</ref>, and open squares from Schaefer ''et al.'', 2025<ref name="SchaeferEtAl2025"/>. ]] |
| − | Lysimeters, generally speaking, refer to instruments which collect water from unsaturated soils<ref name="MeissnerEtAl2020"/><ref name="RogersMcConnell1993"/>. However, there are multiple types of lysimeters which can be employed in field or laboratory settings. There are three primary types of lysimeters relevant to PFAS listed here and shown in Figure 1a-d.
| + | [[File: TranFig2.png | thumb | 600 px | Figure 2: Flowchart diagram of field screening procedures]] |
| − | # <u>Suction Lysimeters (Figure 1a,b):</u> These lysimeters are the most relevant for PFAS sampling and are the majority of discussion in this article. These lysimeters operate by extracting liquid from the unsaturated vadose zone by applying negative suction pressure at the sampling head<ref name="CostanzaEtAl2025"/><ref name="SchaeferEtAl2024"/><ref name="QuinnanEtAl2021"/>. The sampling head is typically constructed of porous ceramic or stainless steel. A PVC case or stainless-steel case is attached to the sampling head and extends upward above the ground surface. Suction lysimeters are typically installed between 1 and 9 feet below ground surface, but can extend as deep as 40-60 feet in some cases<ref name="CostanzaEtAl2025"/>. Shallow lysimeters (< 10 feet) are typically installed using a hand auger. For ceramic lysimeters, a silica flour slurry should be placed at the base of the bore hole and allowed to cover the ceramic head before backfilling the hole partially with natural soil. Once the hole is partially backfilled with soil to cover the sampling head, the remainder of the casing should be sealed with hydrated bentonite chips. When sampling events occur, suction is applied at the ground surface using a rubber gasket seal and a hand pump or electric pump. After sufficient porewater is collected (the time for which can vary greatly based on the soil permeability and moisture content), the seal can be removed and a peristaltic pump used to extract liquid from the lysimeter.
| + | The recommended approach builds upon the methodology and findings of a recent study<ref name="SchaeferEtAl2025">Schaefer, C.E., Tran, D., Nguyen, D., Latta, D.E., Werth, C.J., 2025. Evaluating Mineral and In Situ Indicators of Abiotic Dechlorination in Clayey Soils. Groundwater Monitoring and Remediation, 45(2), pp. 31-39. [https://doi.org/10.1111/gwmr.12709 doi: 10.1111/gwmr.12709]</ref>, emphasizing field-based and analytical techniques to quantify abiotic first-order reductive dechlorination rate constants for PCE and TCE in clayey soils under anoxic conditions. Key components of this evaluation are listed below: |
| − | # <u>Field Lysimeters (Figure 1c):</u> These large lysimeters can be constructed from plastic or metal sidings. They can range from approximately 2 feet in diameter to as large as several meters in diameter<ref name="MeissnerEtAl2020"/>. Instrumentation such as soil moisture probes and tensiometers, or even multiple suction lysimeters, are typically placed throughout the lysimeter to measure the movement of water and determine characteristic soil moisture release curves<ref name="Stannard1992"/><ref name="WintonWeber1996"/><ref name="SchaeferEtAl2023"/><ref name="SchaeferEtAl2022"/><ref>van Genuchten, M.Th. , 1980. A Closed‐form Equation for Predicting the Hydraulic Conductivity of Unsaturated Soils. Soil Science Society of America Journal, 44(5), pp. 892-898. [https://doi.org/10.2136/sssaj1980.03615995004400050002x doi: 10.2136/sssaj1980.03615995004400050002x]</ref>. Water is typically collected at the base of the field lysimeter to determine net recharge through the system. These field lysimeters are intended to represent more realistic, intermediate scale conditions of field systems.
| + | #<u>Zone Identification:</u> The focus of the investigation should be to delineate clayey zones adjacent to hydraulically conductive zones. |
| − | # <u>Drainage Lysimeters (Figure 1d):</u> Also known as a “wick” lysimeter, these lysimeters typically consist of a hollow cup attached to a spout which protrudes above ground to relieve air pressure from the system and act as a sampling port. The hollow cup typically has filters and wicking devices at the base to collect water from the soil. The cup is filled with natural soil and collects water as it percolates through the vadose zone. These lysimeters are used to directly monitor net recharge from the vadose zone to the groundwater table and could be useful in determining PFAS mass flux. | + | #<u>Ferrous Mineral Quantification:</u> Assess ferrous mineral context in clay via 1% HCl extraction at ambient temperature over a 10-minute interval. |
| | + | #<u>Mineralogical Characterization:</u> Conduct XRD analysis with the specific intent of identifying the presence of pyrite and biotite. |
| | + | #<u>Reduced Gas Analysis:</u> Measurement of reduced gases such as acetylene, ethene, and ethane concentrations in clay samples. Gas-tight sampling devices (e.g., En Core® soil samplers by En Novative Technologies, Inc.) should be used to ensure sample integrity during collection and transport. |
| | | | |
| − | ==Analysis of PFAS Concentrations in Soil and Porewater==
| + | Clay samples should be collected within a few centimeters of the high-permeability interface, with optional additional sampling further inward. For mineralogical analysis, a defined interval may be collected and subsequently subsampled. To preserve sample integrity, exposure to air should be minimized during collection, transport, and handling. Homogenization should occur within an anaerobic chamber, and if subsamples are required for external analysis, they must be shipped in gas-tight, anaerobic containers. |
| − | {| class="wikitable mw-collapsible" style="float:left; margin-right:20px; text-align:center;"
| |
| − | |+Table 1. Measured and Predicted PFAS Concentrations in Porewater for Select PFAS in Three Different Soils
| |
| − | |-
| |
| − | !Site
| |
| − | !PFAS
| |
| − | !Field</br>Porewater</br>Concentration</br>(μg/L)
| |
| − | !Lab Core</br>Porewater</br>Concentration</br>(μg/L)
| |
| − | !Predicted</br>Porewater</br>Concentration</br>(μg/L)
| |
| − | |-
| |
| − | |Site A||PFOS||6.2 ± 3.4||3.0 ± 0.37||6.6 ± 3.3
| |
| − | |-
| |
| − | |Site B||PFOS||2.2 ± 2.0||0.78 ± 0.38||2.8
| |
| − | |-
| |
| − | |rowspan="3"|Site C||PFOS||13 ± 4.1||680 ± 460||164 ± 75
| |
| − | |-
| |
| − | |8:2 FTS||1.2 ± 0.46||52 ± 13||16 ± 6.0
| |
| − | |-
| |
| − | |PFHpS||0.36 ± 0.051||2.9 ± 2.0||5.9 ± 3.4
| |
| − | |}
| |
| − | [[File: StultsFig2.png | thumb | 600 px | Figure 2. Field Measured PFAS concentration Data (Orange) and Lab Core Measured Concentration Data (Blue) for four PFAS impacted sites<ref name="AndersonEtAl2022"/>]]
| |
| − | [[File: StultsFig3.png | thumb | 400 px | Figure 3. Measured and predicted data for PFAS concentrations from a single site field lysimeter study. Model predictions both with and without PFAS sorption to the air-water interface were considered<ref name="SchaeferEtAl2023"/>.]]
| |
| − | Schaefer ''et al.''<ref name="SchaeferEtAl2024"/> measured PFAS porewater concentrations with field and laboratory suction lysimeters across several sites. Intact cores from the site were collected for soil water extraction using laboratory lysimeters. The lysimeters were used to directly compare field derived measurements of PFAS concentration in the mobile porewater phase. Results from measurements are for four sites presented in Figure 2.
| |
| | | | |
| − | Data from sites A and B showed reasonably good agreement (within ½ order of magnitude) for most PFAS measured in the systems. At site C, more hydrophobic constituents (> C6 PFAS) tended to have higher concentrations in the lab core than the field site while less hydrophobic constituents (< C6) had higher concentrations in the field than lab cores. Site D showed substantially greater (1 order of magnitude or more) PFAS concentrations measured in the laboratory-collected porewater sample compared to what was measured in the field lysimeters. This discrepancy for the Site D soil can likely be attributed to soil heterogeneity (as indicated by ground penetrating radar) and the fact that the soil consisted of back-filled materials rather than undisturbed native soils.
| + | Estimation of the abiotic reductive first-order rate constant for PCE and TCE is based on the “reactive” ferrous content in the clay. Reactive ferrous content (Fe(II)<sub>r</sub>) is estimated as shown in Equation 1: |
| − |
| |
| − | Site C showed elevated PFAS concentrations in the laboratory collected porewater for the more surface-active compounds. This increase was attributed to the soil wetting that occurred at the bench scale, which was reasonably described by the model shown in Equations 1 and 2 (see Table 1<ref name="AndersonEtAl2022"/>). Equations 1 and 2 were also used to predict PFAS porewater concentrations (using porous cup lysimeters) in a highly instrumented test cell<ref name="SchaeferEtAl2023"/>(Figure 3). The ability to predict soil concentrations from recurring porewater samples is critical to the practical application of lysimeters in field settings<ref name="AndersonEtAl2022"/>.
| |
| | | | |
| − | Results from suction lysimeters studies and field lysimeter studies show that PFAS concentrations in porewater predicted from soil concentrations using Equations 1 and 2 generally have reasonable agreement with measured ''in situ'' porewater data when air-water interfacial partitioning is considered. Results show that for less hydrophobic components like PFOA, the impact of air-water interfacial adsorption is less significant than for highly hydrophobic components like PFOS. The soil for the field lysimeter in Figure 3 was a sandy soil with a relatively low air-water interfacial area. The effect of air-water interfacial partitioning is expected to be much more significant for a greater range of PFAS in soils with high capillary pressure (i.e. silts/clays) with higher associated air-water interfacial areas<ref name="Brusseau2023"/><ref>Peng, S., Brusseau, M.L., 2012. Air-Water Interfacial Area and Capillary Pressure: Porous-Medium Texture Effects and an Empirical Function. Journal of Hydrologic Engineering, 17(7), pp. 829-832. [https://doi.org/10.1061/(asce)he.1943-5584.0000515 doi: 10.1061/(asce)he.1943-5584.0000515]</ref>.
| + | ::'''Equation 1:''' <big>''Fe(II)<sub><small>r</small></sub> = DA + XRD<sub><small>pyr</small></sub> - XRD<sub><small>biotite</small></sub>''</big> |
| | | | |
| − | ==Recommendations== | + | where ''DA'' is the ferrous content from the dilute acid (1% HCl) extraction, ''XRD<sub><small>pyr</small></sub>'' is the pyrite content from XRD analysis, and ''XRD<sub><small>biotite</small></sub>'' is the biotite content from XRD analysis<ref name="SchaeferEtAl2025"/>. |
| − | Recent research suggests:
| + | |
| − | *Successful thermal treatment of PFAS may require a higher target temperature than for other organics with similar boiling points
| + | Abiotic dechlorination is unlikely to contribute to mitigating contaminant back-diffusion when reactive ferrous iron (Fe(II)<sub><small>r</small></sub>) concentrations are below 100 mg/kg (Figure 1). For Fe(II)<sub><small>r</small></sub> above 100 mg/kg, the first-order rate constant for PCE and TCE reductive dechlorination can be estimated using the correlation shown in Figure 1<ref name="SchaeferEtAl2018">Schaefer, C.E., Ho, P., Berns, E., Werth, C., 2018. Mechanisms for abiotic dechlorination of trichloroethene by ferrous minerals under oxic and anoxic conditions in natural sediments. Environmental Science and Technology, 52(23), pp.13747-13755. [https://doi.org/10.1021/acs.est.8b04108 doi: 10.1021/acs.est.8b04108]</ref><ref>Borden, R.C., Cha, K.Y., 2021. Evaluating the impact of back diffusion on groundwater cleanup time. Journal of Contaminant Hydrology, 243, Article 103889. [https://doi.org/10.1016/j.jconhyd.2021.103889 doi: 10.1016/j.jconhyd.2021] [[Media: BordenCha2021.pdf | Open Access Manuscript]]</ref>. The rate constant exhibits a strong positive correlation with the logarithm of reactive Fe(II) content (Pearson’s ''r'' = 0.82), with a slope of 4.7 × 10⁻⁸ L g⁻¹ d⁻¹ (log mg kg⁻¹)⁻¹. |
| − | *Prevention of influx of water into treatment zone may be necessary.
| + | |
| − | Future studies should examine the potential for enhanced degradation during the thermal process by using soil amendments and/or manipulation of the local geochemistry to reduce the required treatment temperatures and therefore also reduce energy demand.
| + | Figure 2 presents a decision flowchart designed to evaluate the significance and extent of abiotic reductive dechlorination. By applying Equation 1 to the dilute acid extractable Fe(II) plus measured mineral species data from clay samples, the reactive ferrous iron content (Fe(II)<sub><small>r</small></sub>) can be quantified, enabling a streamlined assessment of the extent to which abiotic processes are contributing to the mitigation of contaminant back-diffusion. |
| | + | |
| | + | If Fe(II)r is ≥ 100 mg/kg, a first-order dechlorination rate constant can be estimated and subsequently used within a contaminant fate and transport model. However, if acetylene is detected in the clay, even with Fe(II)r less than 100 mg/kg, then bench-scale testing using methods similar to those described in a recent study<ref name="SchaeferEtAl2025"/> is recommended, as such results would likely be inconsistent with those shown in Figure 1, suggesting some other mechanism might be involved, or that the system mineralogy might be more complex than anticipated. Even if Fe(II)r ≥ 100 mg/kg, confirmatory bench-scale testing may be conducted for additional verification and to refine estimation of the abiotic dechlorination rate constant. |
| | + | |
| | + | ==Summary and Recommendations== |
| | + | The approach outlined above is intended to serve as a generalized guide for practitioners and site managers to cost-effectively determine the extent to which beneficial abiotic reductive dechlorination reactions are likely occurring in low permeability (e.g., clayey) zones. This approach may be contraindicated if co-contaminants are present. It is currently unclear whether other classes of potentially reactive chemicals, such as trinitrotoluene (TNT) or chlorinated ethanes, could interact competitively with PCE and TCE. |
| | + | |
| | + | In addition, it remains unclear how other classes of compounds such as per- and polyfluoroalkyl substances (PFAS) may interact or sorb with ferrous minerals and potentially inhibit abiotic dechlorination reactions. Coupling these recommended activities with conventional site investigation tasks would provide an opportunity to perform many of the up-front screening activities with minimal additional project costs. It is important to note that the guidance proposed herein pertains to particularly low permeability media. Sites with complex or varying lithology, where the mineralogy and/or redox conditions may vary, might require evaluation of multiple samples to provide appropriate site-wide information. |
| | + | |
| | + | <br clear="right"/> |
| | | | |
| | ==References== | | ==References== |
| Line 70: |
Line 55: |
| | | | |
| | ==See Also== | | ==See Also== |
| | + | *[https://serdp-estcp.mil/projects/details/a7e3f7b5-ed82-4591-adaa-6196ff33dd60 ESTCP Project ER20-5031 – In Situ Verification and Quantification of Naturally Occurring Dechlorination Rates in Clays: Demonstrating Processes that Mitigate Back-Diffusion and Plume Persistence] |
Estimating PCE/TCE Abiotic First-Order Reductive Dechlorination Rate Constants in Clayey Soils Under Anoxic Conditions
The U.S. Department of Defense (DoD) faces many challenges in restoring aquifers at contaminated sites, often due to back-diffusion of tetrachloroethene (PCE) and trichloroethene (TCE) from low-permeability clay zones. The uptake, storage, and subsequent long-term release of these dissolved contaminants from clays are key processes in understanding the longevity, intensity, and risks associated with many persistent chlorinated ethene groundwater plumes. Although naturally occurring abiotic and biotic dechlorination processes in clays may reduce stored contaminant mass and significantly aid natural attenuation, no standardized field method currently exists to verify or quantify these reactions. It is critical to remediation design efforts to demonstrate and validate a cost-effective in situ approach for assessing these dechlorination processes using first-order rate constants. An approach was developed and applied across eight DoD sites to support Remedial Project Managers (RPMs) and regulators in evaluating natural attenuation potential in clay-rich environments.
Related Article(s):
Contributors: Dani Tran, Dr. Charles Schaefer, Dr. Charles Werth
Key Resource:
- Schaefer, C.E, Tran, D., Nguyen, D., Latta, D.E., Werth, C.J., 2025. Evaluating Mineral and In Situ Indicators of Abiotic Dechlorination in Clayey Soils[1]
Introduction
Cost-effective methods are needed to verify the occurrence of natural dechlorination processes and quantify their dechlorination rates in clays under ambient in situ conditions in order to reliably predict their long-term influence on plume longevity and mass discharge. However, accurately determining these rates is challenging due to slow reaction kinetics, the transient nature of transformation products, and the interplay of biotic and abiotic mechanisms within the clay matrix or at clay-sand interfaces. Tools capable of quantifying these reactions and assessing their role in mitigating plume persistence would be a significant aid for long-term site management.
For reductive abiotic dechlorination under anoxic conditions, a 1% hydrochloric acid (HCl) extraction of a sample of native clay coupled with X-ray diffraction (XRD) data can be used as a screening level tool to estimate reductive dechlorination rate constants. These rate constants can be inserted into fate and transport models such as REMChlor - MD[2][3] to quantify abiotic dechlorination impacts within clay aquitards on chlorinated solvent plumes. Thus, determination of the abiotic reductive dechlorination rate constant for a particular clayey soil can be readily utilized to provide a more accurate assessment of aquifer cleanup timeframes for groundwater plumes that are being sustained by contaminant back-diffusion.
Recommended Approach
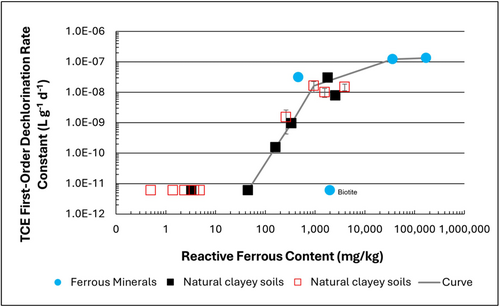
Figure 1: First-order rate constants for abiotic reductive dechlorination of TCE under anaerobic conditions. Circles are data from Schaefer
et al., 2021
[4], filled squares from Schaefer
et al., 2018
[5], and Schaefer
et al., 2017
[6], and open squares from Schaefer
et al., 2025
[1].
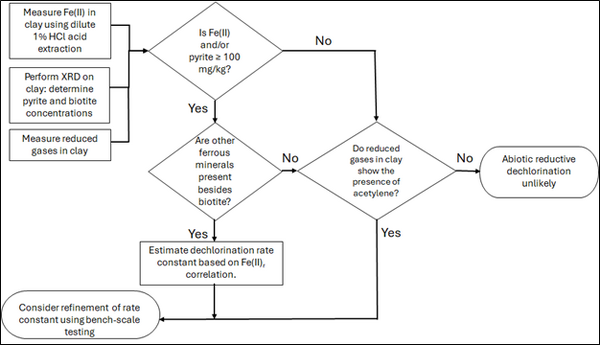
Figure 2: Flowchart diagram of field screening procedures
The recommended approach builds upon the methodology and findings of a recent study[1], emphasizing field-based and analytical techniques to quantify abiotic first-order reductive dechlorination rate constants for PCE and TCE in clayey soils under anoxic conditions. Key components of this evaluation are listed below:
- Zone Identification: The focus of the investigation should be to delineate clayey zones adjacent to hydraulically conductive zones.
- Ferrous Mineral Quantification: Assess ferrous mineral context in clay via 1% HCl extraction at ambient temperature over a 10-minute interval.
- Mineralogical Characterization: Conduct XRD analysis with the specific intent of identifying the presence of pyrite and biotite.
- Reduced Gas Analysis: Measurement of reduced gases such as acetylene, ethene, and ethane concentrations in clay samples. Gas-tight sampling devices (e.g., En Core® soil samplers by En Novative Technologies, Inc.) should be used to ensure sample integrity during collection and transport.
Clay samples should be collected within a few centimeters of the high-permeability interface, with optional additional sampling further inward. For mineralogical analysis, a defined interval may be collected and subsequently subsampled. To preserve sample integrity, exposure to air should be minimized during collection, transport, and handling. Homogenization should occur within an anaerobic chamber, and if subsamples are required for external analysis, they must be shipped in gas-tight, anaerobic containers.
Estimation of the abiotic reductive first-order rate constant for PCE and TCE is based on the “reactive” ferrous content in the clay. Reactive ferrous content (Fe(II)r) is estimated as shown in Equation 1:
- Equation 1: Fe(II)r = DA + XRDpyr - XRDbiotite
where DA is the ferrous content from the dilute acid (1% HCl) extraction, XRDpyr is the pyrite content from XRD analysis, and XRDbiotite is the biotite content from XRD analysis[1].
Abiotic dechlorination is unlikely to contribute to mitigating contaminant back-diffusion when reactive ferrous iron (Fe(II)r) concentrations are below 100 mg/kg (Figure 1). For Fe(II)r above 100 mg/kg, the first-order rate constant for PCE and TCE reductive dechlorination can be estimated using the correlation shown in Figure 1[5][7]. The rate constant exhibits a strong positive correlation with the logarithm of reactive Fe(II) content (Pearson’s r = 0.82), with a slope of 4.7 × 10⁻⁸ L g⁻¹ d⁻¹ (log mg kg⁻¹)⁻¹.
Figure 2 presents a decision flowchart designed to evaluate the significance and extent of abiotic reductive dechlorination. By applying Equation 1 to the dilute acid extractable Fe(II) plus measured mineral species data from clay samples, the reactive ferrous iron content (Fe(II)r) can be quantified, enabling a streamlined assessment of the extent to which abiotic processes are contributing to the mitigation of contaminant back-diffusion.
If Fe(II)r is ≥ 100 mg/kg, a first-order dechlorination rate constant can be estimated and subsequently used within a contaminant fate and transport model. However, if acetylene is detected in the clay, even with Fe(II)r less than 100 mg/kg, then bench-scale testing using methods similar to those described in a recent study[1] is recommended, as such results would likely be inconsistent with those shown in Figure 1, suggesting some other mechanism might be involved, or that the system mineralogy might be more complex than anticipated. Even if Fe(II)r ≥ 100 mg/kg, confirmatory bench-scale testing may be conducted for additional verification and to refine estimation of the abiotic dechlorination rate constant.
Summary and Recommendations
The approach outlined above is intended to serve as a generalized guide for practitioners and site managers to cost-effectively determine the extent to which beneficial abiotic reductive dechlorination reactions are likely occurring in low permeability (e.g., clayey) zones. This approach may be contraindicated if co-contaminants are present. It is currently unclear whether other classes of potentially reactive chemicals, such as trinitrotoluene (TNT) or chlorinated ethanes, could interact competitively with PCE and TCE.
In addition, it remains unclear how other classes of compounds such as per- and polyfluoroalkyl substances (PFAS) may interact or sorb with ferrous minerals and potentially inhibit abiotic dechlorination reactions. Coupling these recommended activities with conventional site investigation tasks would provide an opportunity to perform many of the up-front screening activities with minimal additional project costs. It is important to note that the guidance proposed herein pertains to particularly low permeability media. Sites with complex or varying lithology, where the mineralogy and/or redox conditions may vary, might require evaluation of multiple samples to provide appropriate site-wide information.
References
- ^ 1.0 1.1 1.2 1.3 1.4 Schaefer, C.E., Tran, D., Nguyen, D., Latta, D.E., Werth, C.J., 2025. Evaluating Mineral and In Situ Indicators of Abiotic Dechlorination in Clayey Soils. Groundwater Monitoring and Remediation, 45(2), pp. 31-39. doi: 10.1111/gwmr.12709
- ^ Falta, R., and Wang, W., 2017. A semi-analytical method for simulating matrix diffusion in numerical transport models. Journal of Contaminant Hydrology, 197, pp. 39-49. doi: 10.1016/j.jconhyd.2016.12.007 Open Access Manuscript
- ^ Kulkarni, P.R., Adamson, D.T., Popovic, J., Newell, C.J., 2022. Modeling a well-charactized perfluorooctane sulfate (PFOS) source and plume using the REMChlor-MD model to account for matrix diffusion. Journal of Contaminant Hydrology, 247, Article 103986. doi: 10.1016/j.jconhyd.2022.103986 Open Access Manuscript
- ^ Schaefer, C.E., Ho, P., Berns, E., Werth, C., 2021. Abiotic dechlorination in the presence of ferrous minerals. Journal of Contaminant Hydrology, 241, 103839. doi: 10.1016/j.jconhyd.2021.103839 Open Access Manuscript
- ^ 5.0 5.1 Schaefer, C.E., Ho, P., Berns, E., Werth, C., 2018. Mechanisms for abiotic dechlorination of trichloroethene by ferrous minerals under oxic and anoxic conditions in natural sediments. Environmental Science and Technology, 52(23), pp.13747-13755. doi: 10.1021/acs.est.8b04108
- ^ Schaefer, C.E., Ho., Gurr, C., Berns, E., Werth, C., 2017. Abiotic dechlorination of chlorinated ethenes in natural clayey soils: impacts of mineralogy and temperature. Journal of Contaminant Hydrology, 206, pp. 10-17. doi: 10.1016/j.jconhyd.2017.09.007 Open Access Manuscript
- ^ Borden, R.C., Cha, K.Y., 2021. Evaluating the impact of back diffusion on groundwater cleanup time. Journal of Contaminant Hydrology, 243, Article 103889. doi: 10.1016/j.jconhyd.2021 Open Access Manuscript
See Also

