Difference between revisions of "REMChlor - MD"
Debra Tabron (talk | contribs) (Created page with "REMChlor-MD is a free toolkit available for download and is capable of simulating matrix diffusion in groundwater contaminant plumes. It is a significant upgrade from REMChlor...") |
(Tag: Visual edit) |
||
| (9 intermediate revisions by 2 users not shown) | |||
| Line 4: | Line 4: | ||
'''Related Article(s)''': | '''Related Article(s)''': | ||
| + | |||
| + | *[[Dispersion and Diffusion]] | ||
*[[Source Zone Modeling]] | *[[Source Zone Modeling]] | ||
*[[Plume Response Modeling]] | *[[Plume Response Modeling]] | ||
| − | *[[Matrix Diffusion]] | + | *[[Matrix Diffusion]] |
| − | ''' | + | |
| + | '''Contributor(s):''' [[Dr. Ron Falta]] and [[Kien Pham]] | ||
'''Key Resource(s)''': | '''Key Resource(s)''': | ||
| + | |||
*[https://www.serdp-estcp.org/Program-Areas/Environmental-Restoration/Contaminated-Groundwater/Persistent-Contamination/ER-201426 REMChlor-MD Toolkit package] | *[https://www.serdp-estcp.org/Program-Areas/Environmental-Restoration/Contaminated-Groundwater/Persistent-Contamination/ER-201426 REMChlor-MD Toolkit package] | ||
==Matrix Diffusion of Dissolved Contaminants== | ==Matrix Diffusion of Dissolved Contaminants== | ||
| − | Dissolved contaminants, such as chlorinated volatile organic compounds (CVOCs), are found in groundwater at many current and former industrial sites globally. Plumes of CVOCs dissolved in groundwater often originate when the chemicals enter the subsurface as dense non-aqueous phase liquids (DNAPL). Being heavier than water and immiscible, DNAPLs are particularly problematic because they can spread vertically into the aquifer, generating extensive contaminated groundwater plumes. In Figure 1, CVOCs in DNAPL form are shown in bold red, and the resulting dissolved groundwater plume is represented by the pink halo emanating from the DNAPLs. One of the most significant lessons learned about chlorinated solvents is that their groundwater plumes can persist even when the source DNAPLs have been depleted. Plume persistence in the absence of source materials has been attributed to a phenomenon called matrix diffusion. Matrix diffusion can affect any type of dissolved contaminant, particularly when dissolved concentrations are high relative to regulatory standards. In addition to CVOCs, matrix diffusion can occur with other dissolved contaminants including radionuclides, per- and polyfluoroalkyl substances (PFAS), dissolved petroleum hydrocarbons such as benzene, toluene, ethylbenzene, and xylene (BTEX), and with solvent stabilizers such as 1,4- | + | [[File:Falta1w2 Fig1.png|thumb|450px|Figure 1. Spread of CVOCs in the Subsurface]] |
| − | + | Dissolved contaminants, such as [[Chlorinated Solvents | chlorinated volatile organic compounds (CVOCs)]], are found in groundwater at many current and former industrial sites globally. Plumes of CVOCs dissolved in groundwater often originate when the chemicals enter the subsurface as dense non-aqueous phase liquids (DNAPL). Being heavier than water and immiscible, DNAPLs are particularly problematic because they can spread vertically into the aquifer, generating extensive contaminated groundwater plumes. In Figure 1, CVOCs in DNAPL form are shown in bold red, and the resulting dissolved groundwater plume is represented by the pink halo emanating from the DNAPLs. One of the most significant lessons learned about chlorinated solvents is that their groundwater plumes can persist even when the source DNAPLs have been depleted. Plume persistence in the absence of source materials has been attributed to a phenomenon called matrix diffusion. Matrix diffusion can affect any type of dissolved contaminant, particularly when dissolved concentrations are high relative to regulatory standards. In addition to CVOCs, matrix diffusion can occur with other dissolved contaminants including radionuclides, [[Perfluoroalkyl and Polyfluoroalkyl Substances (PFAS) | per- and polyfluoroalkyl substances (PFAS)]], dissolved petroleum hydrocarbons such as benzene, toluene, ethylbenzene, and xylene (BTEX), and with solvent stabilizers such as [[1,4-Dioxane | 1,4-dioxane]]. | |
| − | The life cycle of a matrix diffusion site is separated into two periods. In the loading period, the low-permeability (low K) zones act as storage areas for the contaminant mass. Following clean-up actions in the transmissive (high K) zones, the concentration gradient is reversed. The unloading period begins when the contaminant mass previously stored in the low-permeability zones diffuses back out into the transmissive zones. In Figure 1, the blue arrows represent the forward and backward diffusion gradients into the surrounding materials. Because the pace of back diffusion can be significantly slower than the loading of the contaminant, the plume resulting from the back diffusing mass can last for decades to centuries<ref>Chapman, S.W. and Parker, B.L., 2005. Plume persistence due to aquitard back diffusion following dense nonaqueous phase liquid source removal or isolation. Water Resources Research, 41(12). [https://doi.org/10.1029/2005WR004224 doi: 10.1029/2005WR004224]</ref><ref>Parker, B.L., Chapman, S.W. and Guilbeault, M.A., 2008. Plume persistence caused by back diffusion from thin clay layers in a sand aquifer following TCE source-zone hydraulic isolation. Journal of Contaminant Hydrology, 102(1-2), pp.86-104. [https://doi.org/10.1016/j.jconhyd.2008.07.003 doi: 10.1016/j.jconhyd.2008.07.003]</ref>. | + | The life cycle of a matrix diffusion site is separated into two periods. In the loading period, the [[Characterization Methods – Hydraulic Conductivity | low-permeability (low K)]] zones act as storage areas for the contaminant mass. Following clean-up actions in the transmissive (high K) zones, the concentration gradient is reversed. The unloading period begins when the contaminant mass previously stored in the low-permeability zones diffuses back out into the transmissive zones. In Figure 1, the blue arrows represent the forward and backward diffusion gradients into the surrounding materials. Because the pace of back diffusion can be significantly slower than the loading of the contaminant, the plume resulting from the back diffusing mass can last for decades to centuries<ref>Chapman, S.W. and Parker, B.L., 2005. Plume persistence due to aquitard back diffusion following dense nonaqueous phase liquid source removal or isolation. Water Resources Research, 41(12). [https://doi.org/10.1029/2005WR004224 doi: 10.1029/2005WR004224]</ref><ref>Parker, B.L., Chapman, S.W. and Guilbeault, M.A., 2008. Plume persistence caused by back diffusion from thin clay layers in a sand aquifer following TCE source-zone hydraulic isolation. Journal of Contaminant Hydrology, 102(1-2), pp.86-104. [https://doi.org/10.1016/j.jconhyd.2008.07.003 doi: 10.1016/j.jconhyd.2008.07.003]</ref>. |
Given the prevalence and persistence of back diffusion plumes, modeling tools are needed that can accurately capture the dynamic progression of the contamination in both loading and unloading periods. | Given the prevalence and persistence of back diffusion plumes, modeling tools are needed that can accurately capture the dynamic progression of the contamination in both loading and unloading periods. | ||
==Matrix Diffusion Modeling Options== | ==Matrix Diffusion Modeling Options== | ||
| + | [[File:Falta1w2 Fig2.PNG|thumb|450px|Figure 2. A Typical Fine Grid Model Capable of Simulating Matrix Diffusion]] | ||
There have been limited options available for simulating matrix diffusion effects at groundwater contamination sites. Available analytical models require simplifications that may overlook the unique complexities at actual remediation sites. Numerical models are often used to simulate solute transport, but require fine discretization to capture matrix diffusion concentration gradients, which occur at millimeters to centimeters scale. This very fine discretization (fine model grid) greatly increases the number of model cells required to simulate transport at field sites, greatly increasing computer model run times. Figure 2 shows a typical fine grid model containing almost 3 million gridblocks (cells). | There have been limited options available for simulating matrix diffusion effects at groundwater contamination sites. Available analytical models require simplifications that may overlook the unique complexities at actual remediation sites. Numerical models are often used to simulate solute transport, but require fine discretization to capture matrix diffusion concentration gradients, which occur at millimeters to centimeters scale. This very fine discretization (fine model grid) greatly increases the number of model cells required to simulate transport at field sites, greatly increasing computer model run times. Figure 2 shows a typical fine grid model containing almost 3 million gridblocks (cells). | ||
| − | |||
Another type of numerical model of matrix diffusion is the dual-porosity model which is more computationally efficient because it uses a first order approximation to describe the mass transfer between the high K and low K zones. Dual-porosity models can be calibrated to match the effects of matrix diffusion on contaminant concentrations over short time periods. However, the first order mass transfer coefficient is time-dependent<ref>Guan, J., Molz, F.J., Zhou, Q., Liu, H.H. and Zheng, C., 2008. Behavior of the mass transfer coefficient during the MADE‐2 experiment: New insights. Water Resources Research, 44(2). [https://doi.org/10.1029/2007WR006120 doi: 10.1029/2007WR006120]</ref>, so models calibrated to early time data will not accurately simulate concentrations at a later time. | Another type of numerical model of matrix diffusion is the dual-porosity model which is more computationally efficient because it uses a first order approximation to describe the mass transfer between the high K and low K zones. Dual-porosity models can be calibrated to match the effects of matrix diffusion on contaminant concentrations over short time periods. However, the first order mass transfer coefficient is time-dependent<ref>Guan, J., Molz, F.J., Zhou, Q., Liu, H.H. and Zheng, C., 2008. Behavior of the mass transfer coefficient during the MADE‐2 experiment: New insights. Water Resources Research, 44(2). [https://doi.org/10.1029/2007WR006120 doi: 10.1029/2007WR006120]</ref>, so models calibrated to early time data will not accurately simulate concentrations at a later time. | ||
| − | The REMChlor-MD model was developed under ESTCP project [https://www.serdp-estcp.org/Program-Areas/Environmental-Restoration/Contaminated-Groundwater/Persistent-Contamination/ER-201426 | + | The REMChlor-MD model was developed under ESTCP project [https://www.serdp-estcp.org/Program-Areas/Environmental-Restoration/Contaminated-Groundwater/Persistent-Contamination/ER-201426 ER-201426] to provide a practical alternative to previous approaches for modeling matrix diffusion. |
==REMChlor-MD’s Modeling Approach== | ==REMChlor-MD’s Modeling Approach== | ||
| − | REMChlor-MD employs a semi-analytical method adapted from a heat diffusivity estimation strategy used in petroleum engineering and applied here to the problem of chemical diffusion with first order decay kinetics<ref>Vinsome, P.K.W. and Westerveld, J., 1980. A simple method for predicting cap and base rock heat losses in'thermal reservoir simulators. Journal of Canadian Petroleum Technology, 19(03). Pp 87-90 [https://doi.org/10.2118/80-03-04 doi: 10.2118/80-03-04]</ref><ref name= "Falta2017">Falta, R.W. and Wang, W., 2017. A semi-analytical method for simulating matrix diffusion in numerical transport models. Journal of contaminant hydrology, 197, pp.39-49. [https://doi.org/10.1016/j.jconhyd.2016.12.007 doi: 10.1016/j.jconhyd.2016.12.007]</ref>. This semi-analytical method utilizes a fitting function to describe the concentration of the chemical in the low K zones in, or adjacent to, each gridblock: | + | REMChlor-MD employs a semi-analytical method adapted from a heat diffusivity estimation strategy used in petroleum engineering and applied here to the problem of chemical diffusion with first order decay kinetics<ref>Vinsome, P.K.W. and Westerveld, J., 1980. A simple method for predicting cap and base rock heat losses in'thermal reservoir simulators. Journal of Canadian Petroleum Technology, 19(03). Pp 87-90 [https://doi.org/10.2118/80-03-04 doi: 10.2118/80-03-04]</ref><ref name="Falta2017">Falta, R.W. and Wang, W., 2017. A semi-analytical method for simulating matrix diffusion in numerical transport models. Journal of contaminant hydrology, 197, pp.39-49. [https://doi.org/10.1016/j.jconhyd.2016.12.007 doi: 10.1016/j.jconhyd.2016.12.007]</ref>. This semi-analytical method utilizes a fitting function to describe the concentration of the chemical in the low K zones in, or adjacent to, each gridblock: |
| + | |||
| + | ::'''Equation 1:''' <big>''C<sub>l</sub>''</big>''(z<sub>l</sub>,t)<big> = (C</big><sup>t + Δt</sup><big> + pz<sub>l</sub> + qz<sub>l</sub><sup>2</sup>) e</big><sup>-z<sub>l</sub> / d'' | ||
| − | |||
{| | {| | ||
|- | |- | ||
| − | | where: | + | |where: |
|- | |- | ||
| − | | ''C<sub>l</sub>'' || represents the concentration in the low K material; | + | |''C<sub>l</sub>''||represents the concentration in the low K material; |
|- | |- | ||
| − | | ''C<sup>t + Δt</sup>'' || is the concentration in the high K zone during the next numerical time-step; | + | |''C<sup>t + Δt</sup>''||is the concentration in the high K zone during the next numerical time-step; |
|- | |- | ||
| − | | ''z<sub>l</sub>'' || is the distance into the low K zone from the high K / low K interface; | + | |''z<sub>l</sub>''||is the distance into the low K zone from the high K / low K interface; |
|- | |- | ||
| − | | ''p'' and ''q'' || are fitting parameters that can be solved for by enforcing the diffusion differential equation at the interface and mass conservation in the matrix gridblock; and | + | |''p'' and ''q'' ||are fitting parameters that can be solved for by enforcing the diffusion differential equation at the interface and mass conservation in the matrix gridblock; and |
|- | |- | ||
| − | | ''d'' || is the concentration penetration depth, which is defined in the REMChlor-MD User’s Manual in Appendix 1. | + | |''d''||is the concentration penetration depth, which is defined in the REMChlor-MD User’s Manual in Appendix 1. |
|} | |} | ||
| Line 52: | Line 57: | ||
There are three key geometrical model inputs to the semi-analytical method that can be used to model the diffusion process: | There are three key geometrical model inputs to the semi-analytical method that can be used to model the diffusion process: | ||
| + | |||
*''V<sub>f</sub>'' is the volume fraction of the high-permeability materials in a gridblock; | *''V<sub>f</sub>'' is the volume fraction of the high-permeability materials in a gridblock; | ||
*''A<sub>md</sub>'' is the interfacial area between the high-K and low-K materials in a gridblock; and | *''A<sub>md</sub>'' is the interfacial area between the high-K and low-K materials in a gridblock; and | ||
| Line 60: | Line 66: | ||
::'''Equation 2:''' <big>''A<sub>md</sub> L = (1 – V<sub>f</sub>) V''</big> | ::'''Equation 2:''' <big>''A<sub>md</sub> L = (1 – V<sub>f</sub>) V''</big> | ||
| − | This semi-analytical method has undergone thorough testing and proved to be accurate in numerous scenarios<ref name= "Falta2017"/><ref name= "Muskus2018">Muskus, N. and Falta, R.W., 2018. Semi-analytical method for matrix diffusion in heterogeneous and fractured systems with parent-daughter reactions. Journal of Contaminant Hydrology, 218, pp.94-109. [https://doi.org/10.1016/j.jconhyd.2018.10.002 doi: 10.1016/j.jconhyd.2018.10.002]</ref>. The following section shows common test scenarios where the method can be used. | + | This semi-analytical method has undergone thorough testing and proved to be accurate in numerous scenarios<ref name="Falta2017" /><ref name="Muskus2018">Muskus, N. and Falta, R.W., 2018. Semi-analytical method for matrix diffusion in heterogeneous and fractured systems with parent-daughter reactions. Journal of Contaminant Hydrology, 218, pp.94-109. [https://doi.org/10.1016/j.jconhyd.2018.10.002 doi: 10.1016/j.jconhyd.2018.10.002]</ref>. The following section shows common test scenarios where the method can be used. |
[[File:Falta1w2 Fig3.png|thumb|left|Figure 3. Concentration profiles in fractures at 1, 49, 51 and 100 years.]] | [[File:Falta1w2 Fig3.png|thumb|left|Figure 3. Concentration profiles in fractures at 1, 49, 51 and 100 years.]] | ||
| − | [[File:Falta1w2 Fig4.png|thumb| | + | [[File:Falta1w2 Fig4.png|thumb|right|Figure 4: Simulated mass discharge at downstream edge of fine-grid MT3DMS and REMChlor-MD models.]] |
| − | [[File:Falta1w2 Fig5.png|thumb| | + | [[File:Falta1w2 Fig5.png|thumb|left|Figure 5: Top view (''xy'') of concentration contours computed with the fine-grid numerical model (top) and with REMChlor-MD (bottom) at 30 years.]] |
[[File:Falta1w2 Fig6.png|thumb|right|Figure 6: Top view (''xy'') of concentration contours computed with the fine-grid numerical model (top) and with REMChlor-MD (bottom) at 130 years.]] | [[File:Falta1w2 Fig6.png|thumb|right|Figure 6: Top view (''xy'') of concentration contours computed with the fine-grid numerical model (top) and with REMChlor-MD (bottom) at 130 years.]] | ||
| Line 78: | Line 84: | ||
The match between the analytical solution and the semi-analytical method was good, particularly during the loading period. In the unloading period, the semi-analytical method overestimated the peak concentration somewhat, but it still captured the long tailing of concentration almost exactly. | The match between the analytical solution and the semi-analytical method was good, particularly during the loading period. In the unloading period, the semi-analytical method overestimated the peak concentration somewhat, but it still captured the long tailing of concentration almost exactly. | ||
| − | [[File:Falta1w2 Fig7. | + | [[File:Falta1w2 Fig7.png|thumb|right|400px| link=https://www.enviro.wiki/images/c/c5/Falta1w2_Fig7.mp4 | [//www.enviro.wiki/images/c/c5/Falta1w2_Fig7.mp4 Figure 7: Video tutorial demonstrating use of REMChlor-MD]]] |
===Matrix Diffusion in Heterogeneous Media=== | ===Matrix Diffusion in Heterogeneous Media=== | ||
| − | One of the motivations for REMChlor-MD was to develop an alternative to a computationally expensive fine grid model for simulating matrix diffusion. To evaluate the ability of the semi-analytical method incorporated into REMChlor-MD to accurately simulate back-diffusion, a heterogeneous fine grid model was developed<ref name= "Muskus2018"/> using MT3DMS. A geostatistical model generated multiple realizations of the subsurface’s heterogeneity using synthetic borehole data. Using the heterogeneous material distribution of sand and clay, a fine grid flow and transport model, consisting of almost 3 million gridblocks, was created. A TCE source was present near the upgradient end of the model for 30 years and then it was completely removed. Following source removal, clean water was flushed through the system for another 200 years. | + | One of the motivations for REMChlor-MD was to develop an alternative to a computationally expensive fine grid model for simulating matrix diffusion. To evaluate the ability of the semi-analytical method incorporated into REMChlor-MD to accurately simulate back-diffusion, a heterogeneous fine grid model was developed<ref name="Muskus2018" /> using MT3DMS. A geostatistical model generated multiple realizations of the subsurface’s heterogeneity using synthetic borehole data. Using the heterogeneous material distribution of sand and clay, a fine grid flow and transport model, consisting of almost 3 million gridblocks, was created. A TCE source was present near the upgradient end of the model for 30 years and then it was completely removed. Following source removal, clean water was flushed through the system for another 200 years. |
For comparison, a REMChlor-MD model was developed with a much coarser grid (about 14,000 gridblocks) where flow and transport parameters were comparable to the fine grid model. The mass discharge at the outlet of the models was used as a comparison criterion between the two models. Figure 4 shows a comparison of the computed mass discharge versus time at the downstream edge of the model. The mass discharge predicted by the 3-million gridblock MT2DMS simulation is shown as the yellow dots. The green line shows the REMChlor-MD prediction based on the geostatistical properties of the high and low K zones (characteristic maximum diffusion length, L= 1.85m). The REMChlor-MD match to the fine-grid MT3DMS model was slightly improved by reducing the characteristic maximum diffusion length (L= 1.5m). Both of these results are similar to the 3-million gridblock MT3DMS simulation result. | For comparison, a REMChlor-MD model was developed with a much coarser grid (about 14,000 gridblocks) where flow and transport parameters were comparable to the fine grid model. The mass discharge at the outlet of the models was used as a comparison criterion between the two models. Figure 4 shows a comparison of the computed mass discharge versus time at the downstream edge of the model. The mass discharge predicted by the 3-million gridblock MT2DMS simulation is shown as the yellow dots. The green line shows the REMChlor-MD prediction based on the geostatistical properties of the high and low K zones (characteristic maximum diffusion length, L= 1.85m). The REMChlor-MD match to the fine-grid MT3DMS model was slightly improved by reducing the characteristic maximum diffusion length (L= 1.5m). Both of these results are similar to the 3-million gridblock MT3DMS simulation result. | ||
| Line 88: | Line 94: | ||
==REMChlor-MD User Interface== | ==REMChlor-MD User Interface== | ||
| − | The semi-analytical method was programmed in FORTRAN, and a graphical user interface (GUI) was built using Visual Basic in Excel® to facilitate data inputs and output processing<ref>Farhat, S. K., Newell, C. J., Falta, R. W., and Lynch, K. (2018). REMChlor-MD toolkit user’s manual. ER-201426 [ | + | The semi-analytical method was programmed in FORTRAN, and a graphical user interface (GUI) was built using Visual Basic in Excel® to facilitate data inputs and output processing<ref>Farhat, S. K., Newell, C. J., Falta, R. W., and Lynch, K. (2018). REMChlor-MD toolkit user’s manual. ER-201426 [//www.enviro.wiki/images/0/0b/2018-Falta-REMChlor_Modeling_Matrix_Diffusion_Effects.pdf Report.pdf]</ref>. The Visual Basic REMChlor-MD interface calls the FORTRAN executable using a dynamic link library, and then processes the FORTRAN output files to produce various graphs. A short video tutorial demonstrating data entry and some of the capabilities of REMChlor-MD is shown in Figure 7. Additional detail is provided in an online [https://www.serdp-estcp.org/Tools-and-Training/Webinar-Series/02-07-2019 webinar]. The toolkit package, including a user’s manual is available free of charge and can be downloaded here ([https://www.serdp-estcp.org/content/download/48566/462193/file/REMChlorMD_64bit.zip 64bit version]) and ([https://www.serdp-estcp.org/content/download/48565/462183/file/REMChlorMD_32bit.zip 32 bit version]). Readers are referred to the [https://www.serdp-estcp.org/content/download/48433/460814/file/ER-201426%20REMChlor-MD%20User's%20Manual.pdf user manual] for a complete explanation of the program, its input parameters, outputs, and examples. |
Latest revision as of 20:33, 27 April 2022
REMChlor-MD is a free toolkit available for download and is capable of simulating matrix diffusion in groundwater contaminant plumes. It is a significant upgrade from REMChlor 1.0[1], which does not include matrix diffusion in the plume. REMChlor-MD is useful for planning-level approximations of contamination extent and duration at sites where matrix diffusion is important. REMChlor-MD employes a semi-analytical method for simulating mass transfer between high and low permeability zones that provides computationally accurate predictions of concentration distributions and mass discharge in the higher permeability portions of an aquifer. Model run times for REMChlor-MD are much shorter than traditional fine grid numerical models.
Related Article(s):
Contributor(s): Dr. Ron Falta and Kien Pham
Key Resource(s):
Matrix Diffusion of Dissolved Contaminants
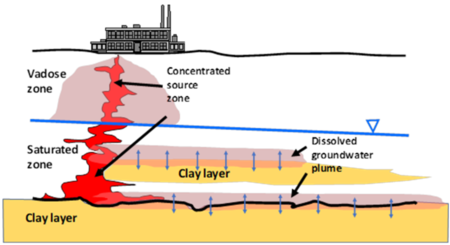
Dissolved contaminants, such as chlorinated volatile organic compounds (CVOCs), are found in groundwater at many current and former industrial sites globally. Plumes of CVOCs dissolved in groundwater often originate when the chemicals enter the subsurface as dense non-aqueous phase liquids (DNAPL). Being heavier than water and immiscible, DNAPLs are particularly problematic because they can spread vertically into the aquifer, generating extensive contaminated groundwater plumes. In Figure 1, CVOCs in DNAPL form are shown in bold red, and the resulting dissolved groundwater plume is represented by the pink halo emanating from the DNAPLs. One of the most significant lessons learned about chlorinated solvents is that their groundwater plumes can persist even when the source DNAPLs have been depleted. Plume persistence in the absence of source materials has been attributed to a phenomenon called matrix diffusion. Matrix diffusion can affect any type of dissolved contaminant, particularly when dissolved concentrations are high relative to regulatory standards. In addition to CVOCs, matrix diffusion can occur with other dissolved contaminants including radionuclides, per- and polyfluoroalkyl substances (PFAS), dissolved petroleum hydrocarbons such as benzene, toluene, ethylbenzene, and xylene (BTEX), and with solvent stabilizers such as 1,4-dioxane.
The life cycle of a matrix diffusion site is separated into two periods. In the loading period, the low-permeability (low K) zones act as storage areas for the contaminant mass. Following clean-up actions in the transmissive (high K) zones, the concentration gradient is reversed. The unloading period begins when the contaminant mass previously stored in the low-permeability zones diffuses back out into the transmissive zones. In Figure 1, the blue arrows represent the forward and backward diffusion gradients into the surrounding materials. Because the pace of back diffusion can be significantly slower than the loading of the contaminant, the plume resulting from the back diffusing mass can last for decades to centuries[2][3].
Given the prevalence and persistence of back diffusion plumes, modeling tools are needed that can accurately capture the dynamic progression of the contamination in both loading and unloading periods.
Matrix Diffusion Modeling Options
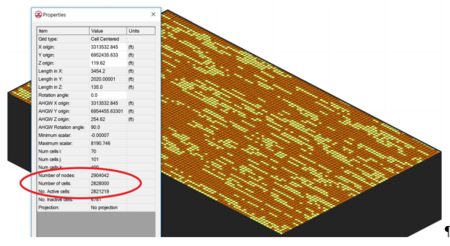
There have been limited options available for simulating matrix diffusion effects at groundwater contamination sites. Available analytical models require simplifications that may overlook the unique complexities at actual remediation sites. Numerical models are often used to simulate solute transport, but require fine discretization to capture matrix diffusion concentration gradients, which occur at millimeters to centimeters scale. This very fine discretization (fine model grid) greatly increases the number of model cells required to simulate transport at field sites, greatly increasing computer model run times. Figure 2 shows a typical fine grid model containing almost 3 million gridblocks (cells).
Another type of numerical model of matrix diffusion is the dual-porosity model which is more computationally efficient because it uses a first order approximation to describe the mass transfer between the high K and low K zones. Dual-porosity models can be calibrated to match the effects of matrix diffusion on contaminant concentrations over short time periods. However, the first order mass transfer coefficient is time-dependent[4], so models calibrated to early time data will not accurately simulate concentrations at a later time.
The REMChlor-MD model was developed under ESTCP project ER-201426 to provide a practical alternative to previous approaches for modeling matrix diffusion.
REMChlor-MD’s Modeling Approach
REMChlor-MD employs a semi-analytical method adapted from a heat diffusivity estimation strategy used in petroleum engineering and applied here to the problem of chemical diffusion with first order decay kinetics[5][6]. This semi-analytical method utilizes a fitting function to describe the concentration of the chemical in the low K zones in, or adjacent to, each gridblock:
- Equation 1: Cl(zl,t) = (Ct + Δt + pzl + qzl2) e-zl / d
| where: | |
| Cl | represents the concentration in the low K material; |
| Ct + Δt | is the concentration in the high K zone during the next numerical time-step; |
| zl | is the distance into the low K zone from the high K / low K interface; |
| p and q | are fitting parameters that can be solved for by enforcing the diffusion differential equation at the interface and mass conservation in the matrix gridblock; and |
| d | is the concentration penetration depth, which is defined in the REMChlor-MD User’s Manual in Appendix 1. |
Using the trial function, the diffusive mass flux can be computed analytically, which is the key time-saving component of the method. The only variable that requires numerical simulation is the concentration in the high-permeability parts of the aquifer.
There are three key geometrical model inputs to the semi-analytical method that can be used to model the diffusion process:
- Vf is the volume fraction of the high-permeability materials in a gridblock;
- Amd is the interfacial area between the high-K and low-K materials in a gridblock; and
- L is the characteristic maximum diffusion length.
Because the volume of low K material in the gridblock should equal the product of the interfacial area and the characteristic maximum diffusion length, the third parameter (L) can be calculated from the first two using the volume balance equation for a gridblock of volume V:
- Equation 2: Amd L = (1 – Vf) V
This semi-analytical method has undergone thorough testing and proved to be accurate in numerous scenarios[6][7]. The following section shows common test scenarios where the method can be used.
Modeling Examples
Matrix Diffusion in Fractured Media
Contaminants in fractured rock media are often the most challenging to remediate because of the small volume of individual fractures and the large surface area of the matrix. Networks of fractures can store a large mass of contaminants and potentially become a secondary source over time.
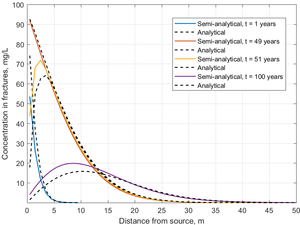
The semi-analytical method was tested in a parallel fractured system, and the results were compared against an exact analytical solution[8]. In this example, the fracture spacing was set at 2 m, and the fracture aperture was 100 µm. A known concentration of trichloroethene (TCE) was introduced into the fractures at the upstream end of the model, where its concentration was held constant for 50 years. Then the contaminant source was completely removed, and clean water was flushed through the fractures for another 50 years. Figure 3 shows the concentration profiles in the fractures calculated using the semi-analytical method over 100 years of simulation time compared to the exact analytical solution.
In the 1-year profile, TCE concentrations in the fractures decreased rapidly with distance, since the steep concentration gradient results in rapid mass transfer from the fracture into the low K matrix. Toward the end of the loading period at 49 years, TCE concentration declines more gradually with distance, since TCE has now diffused into the adjoining low K matrix, reducing the concentration gradient and associated mass flux. At 51 years, one year after source removal, there was a decrease in TCE concentration near the inlet, but almost no effect downstream in the fractures due to back diffusion of TCE from the matrix to the fractures. After 50 years of clean water flushing, back diffusing TCE was still acting as a secondary source, reaching a peak concentration of approximately 16 mg/L. The profiles show a typical fractured system prior to and after source removal with matrix diffusion effects preventing the system from reaching clean-up level.
The match between the analytical solution and the semi-analytical method was good, particularly during the loading period. In the unloading period, the semi-analytical method overestimated the peak concentration somewhat, but it still captured the long tailing of concentration almost exactly.
Matrix Diffusion in Heterogeneous Media
One of the motivations for REMChlor-MD was to develop an alternative to a computationally expensive fine grid model for simulating matrix diffusion. To evaluate the ability of the semi-analytical method incorporated into REMChlor-MD to accurately simulate back-diffusion, a heterogeneous fine grid model was developed[7] using MT3DMS. A geostatistical model generated multiple realizations of the subsurface’s heterogeneity using synthetic borehole data. Using the heterogeneous material distribution of sand and clay, a fine grid flow and transport model, consisting of almost 3 million gridblocks, was created. A TCE source was present near the upgradient end of the model for 30 years and then it was completely removed. Following source removal, clean water was flushed through the system for another 200 years.
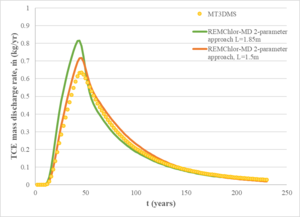
For comparison, a REMChlor-MD model was developed with a much coarser grid (about 14,000 gridblocks) where flow and transport parameters were comparable to the fine grid model. The mass discharge at the outlet of the models was used as a comparison criterion between the two models. Figure 4 shows a comparison of the computed mass discharge versus time at the downstream edge of the model. The mass discharge predicted by the 3-million gridblock MT2DMS simulation is shown as the yellow dots. The green line shows the REMChlor-MD prediction based on the geostatistical properties of the high and low K zones (characteristic maximum diffusion length, L= 1.85m). The REMChlor-MD match to the fine-grid MT3DMS model was slightly improved by reducing the characteristic maximum diffusion length (L= 1.5m). Both of these results are similar to the 3-million gridblock MT3DMS simulation result.
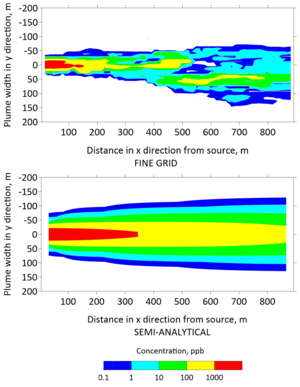
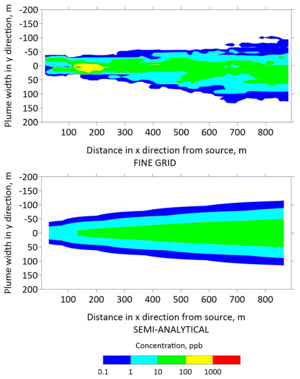
Plan view concentrations from the fine grid model and the semi-analytical model were extracted to generate contours of the TCE plume in Figures 5 and 6 after 30 and 130 years, respectively. The top panels of these figures were generated with the fine grid MT3DMS model, whereas the bottom panels were generated with the REMChlor-MD model. The fine grid contour has jagged edges because small changes in concentration were captured at a higher spatial resolution. In contrast, the semi-analytical contour was smoother because the concentration changes were interpolated over larger gridblocks. However, the overall shape and contours from the two models are similar. On a high performance 2018 workstation, the run time for the fine-grid MT3DMS model was many hours, while the REMChlor-MD model completed its run in a little over one minute.
REMChlor-MD User Interface
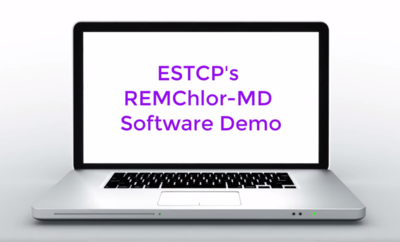
The semi-analytical method was programmed in FORTRAN, and a graphical user interface (GUI) was built using Visual Basic in Excel® to facilitate data inputs and output processing[9]. The Visual Basic REMChlor-MD interface calls the FORTRAN executable using a dynamic link library, and then processes the FORTRAN output files to produce various graphs. A short video tutorial demonstrating data entry and some of the capabilities of REMChlor-MD is shown in Figure 7. Additional detail is provided in an online webinar. The toolkit package, including a user’s manual is available free of charge and can be downloaded here (64bit version) and (32 bit version). Readers are referred to the user manual for a complete explanation of the program, its input parameters, outputs, and examples.
References
- ^ Falta, R.W., 2008. Methodology for comparing source and plume remediation alternatives. Groundwater, 46(2), pp.272-285. doi: 10.1111/j.1745-6584.2007.00416.x
- ^ Chapman, S.W. and Parker, B.L., 2005. Plume persistence due to aquitard back diffusion following dense nonaqueous phase liquid source removal or isolation. Water Resources Research, 41(12). doi: 10.1029/2005WR004224
- ^ Parker, B.L., Chapman, S.W. and Guilbeault, M.A., 2008. Plume persistence caused by back diffusion from thin clay layers in a sand aquifer following TCE source-zone hydraulic isolation. Journal of Contaminant Hydrology, 102(1-2), pp.86-104. doi: 10.1016/j.jconhyd.2008.07.003
- ^ Guan, J., Molz, F.J., Zhou, Q., Liu, H.H. and Zheng, C., 2008. Behavior of the mass transfer coefficient during the MADE‐2 experiment: New insights. Water Resources Research, 44(2). doi: 10.1029/2007WR006120
- ^ Vinsome, P.K.W. and Westerveld, J., 1980. A simple method for predicting cap and base rock heat losses in'thermal reservoir simulators. Journal of Canadian Petroleum Technology, 19(03). Pp 87-90 doi: 10.2118/80-03-04
- ^ 6.0 6.1 Falta, R.W. and Wang, W., 2017. A semi-analytical method for simulating matrix diffusion in numerical transport models. Journal of contaminant hydrology, 197, pp.39-49. doi: 10.1016/j.jconhyd.2016.12.007
- ^ 7.0 7.1 Muskus, N. and Falta, R.W., 2018. Semi-analytical method for matrix diffusion in heterogeneous and fractured systems with parent-daughter reactions. Journal of Contaminant Hydrology, 218, pp.94-109. doi: 10.1016/j.jconhyd.2018.10.002
- ^ Sudicky, E.A. and Frind, E.O., 1982. Contaminant transport in fractured porous media: Analytical solutions for a system of parallel fractures. Water Resources Research, 18(6), pp.1634-1642. doi: 10.1029/WR018i006p01634
- ^ Farhat, S. K., Newell, C. J., Falta, R. W., and Lynch, K. (2018). REMChlor-MD toolkit user’s manual. ER-201426 Report.pdf
